baselhusam/open-webui-exporter
Prometheus exporter for Open WebUI — polls its REST API, no database access required.
1.7K
baselhusam/open-webui-exporter repository overview

Open WebUI Prometheus Exporter




A Prometheus exporter for Open WebUI. It polls Open WebUI's REST API and exposes metrics on /metrics (default port 9090) — users, chats, messages, per-model and per-user token usage, estimated spend, feedback/satisfaction, the model catalog, and exporter self-health.
Open WebUI has no first-party /metrics endpoint, and the existing community exporter needs direct PostgreSQL access. This one talks only to the REST API (including the built-in /api/v1/analytics/* endpoints), so it works against any backend — SQLite or Postgres — with no database credentials, just an admin API key.
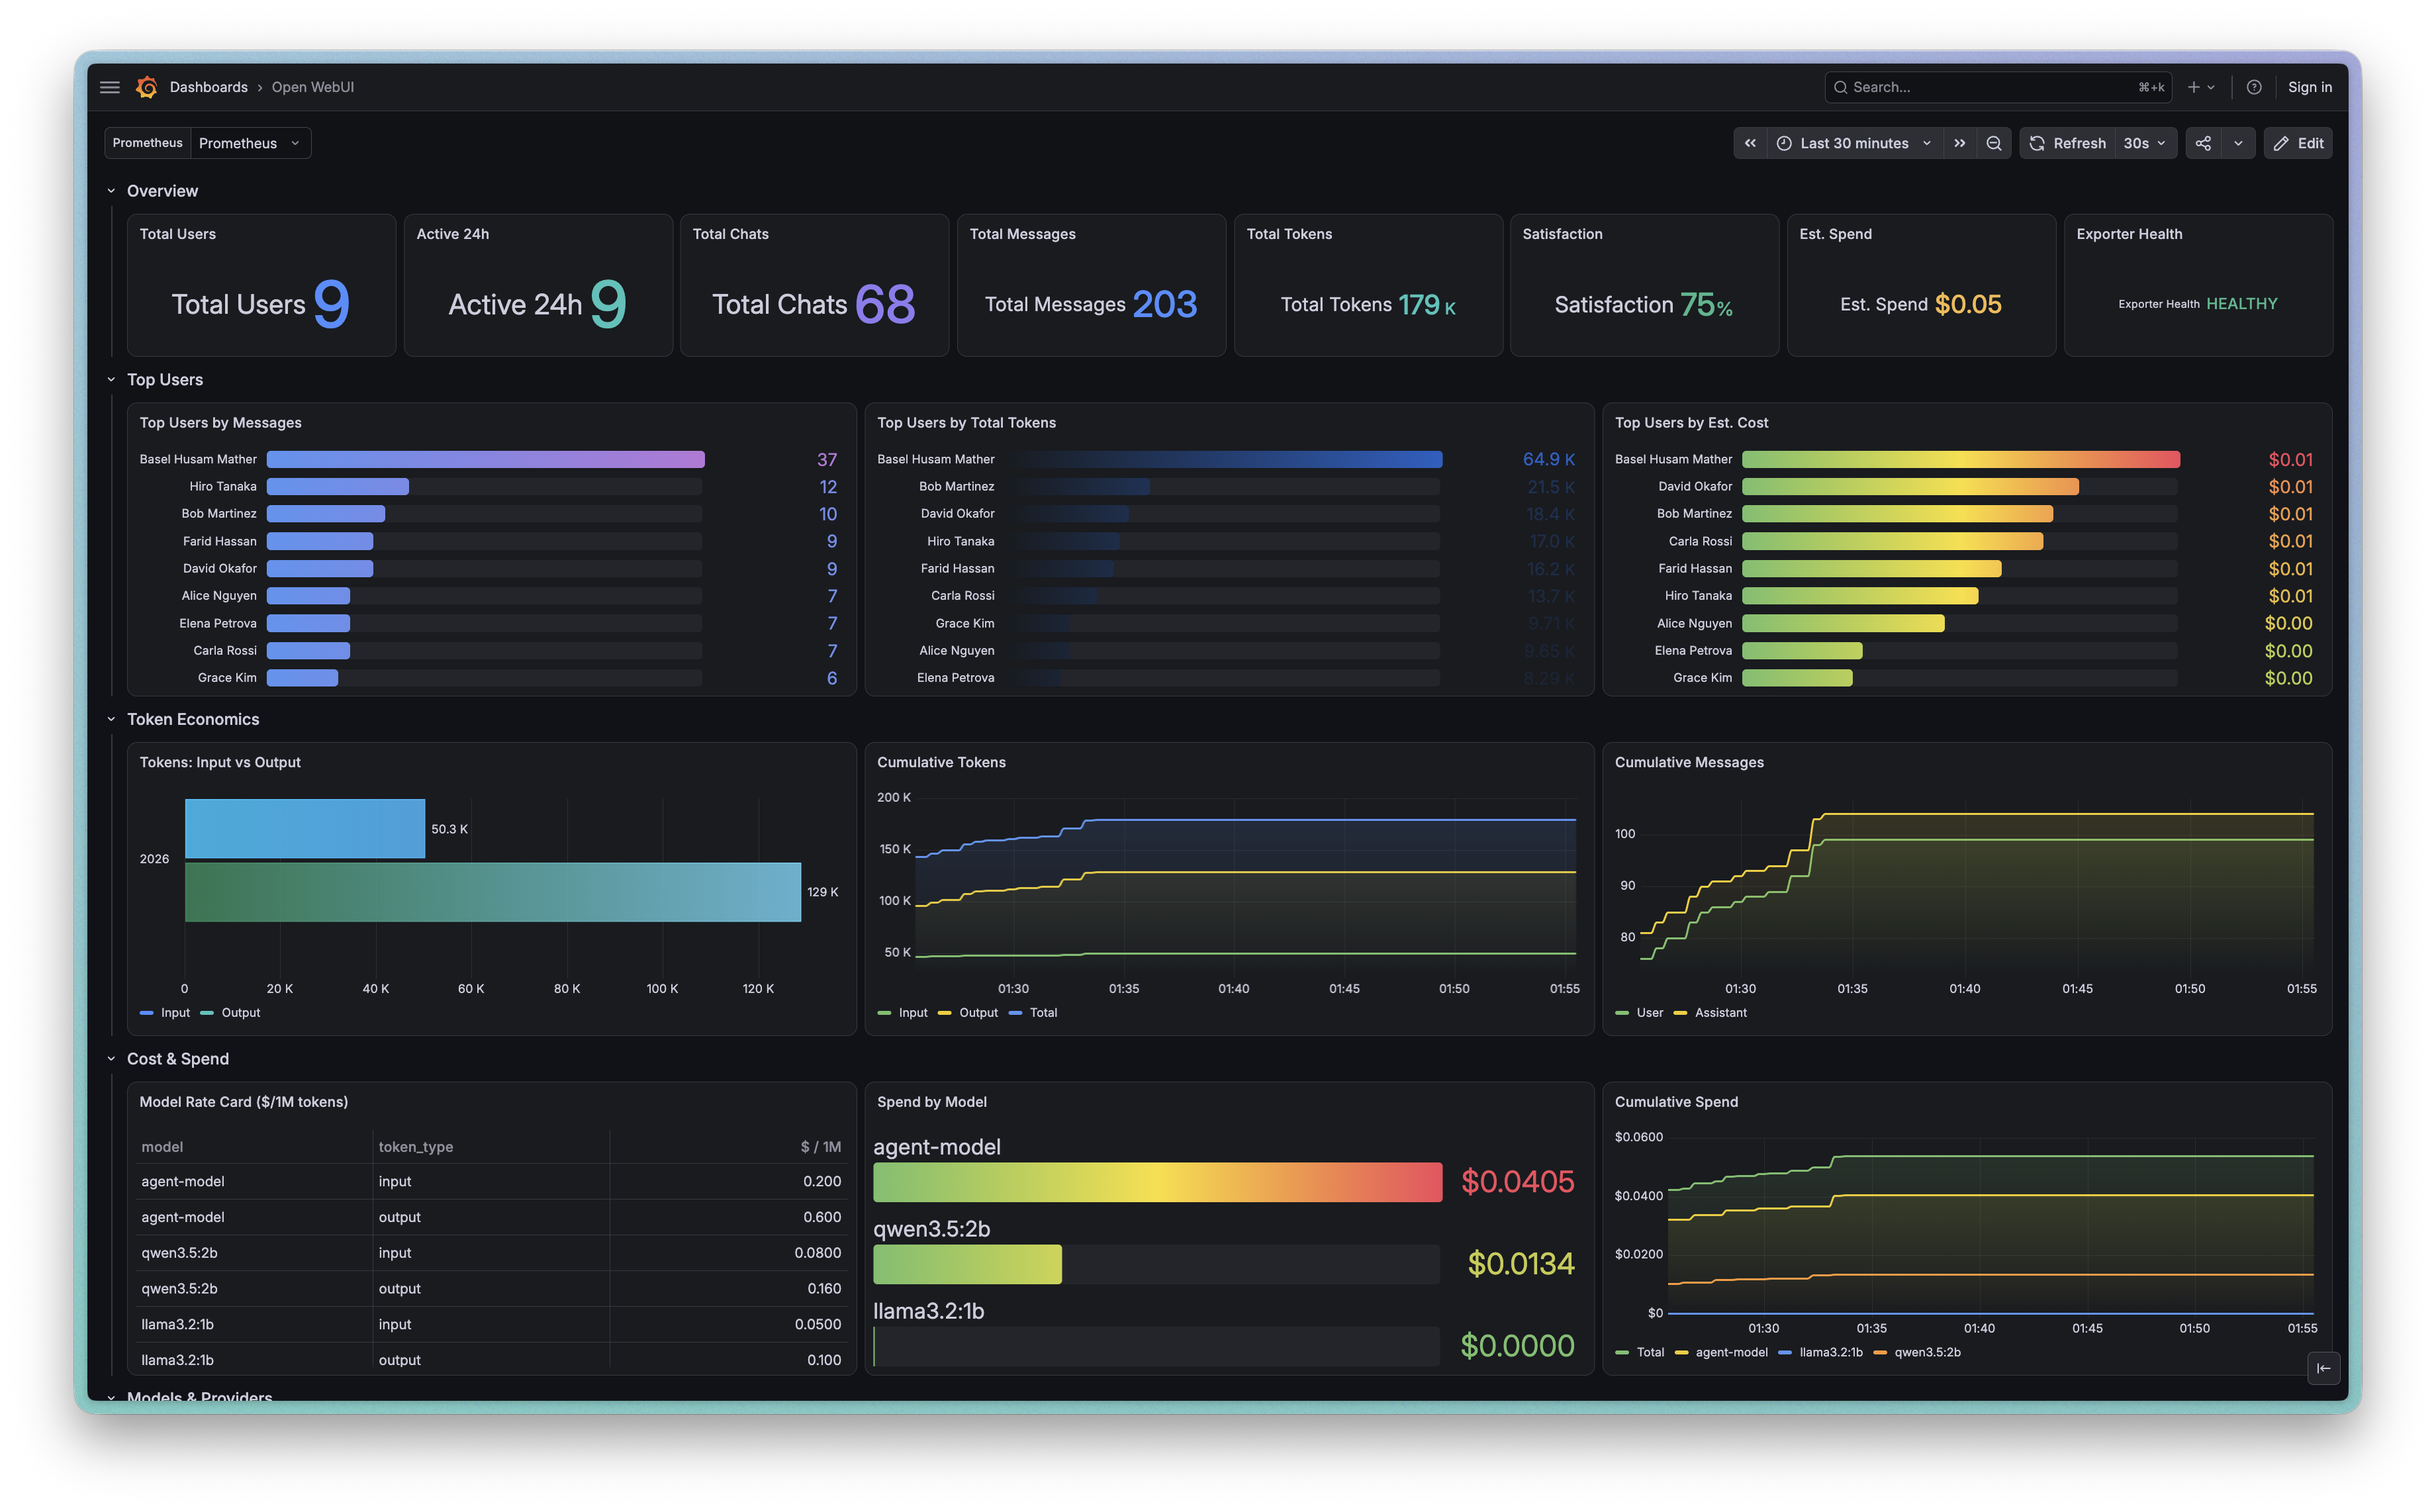
Ships with a ready-made Grafana dashboard: grafana.com/grafana/dashboards/25557.
Supported tags
latest— the currentmainbuildX.Y.Z,X.Y— semver releases (e.g.0.1.0,0.1)sha-<short>— immutable per-commit pins
Built by CI for linux/amd64 and linux/arm64.
Also on GHCR: ghcr.io/baselhusam/open-webui-exporter (same tags).
Quick start
First create an admin API key in Open WebUI: Settings → Account → API Keys → Create new key (enable it under Admin Settings → General → Enable API Key if you don't see it). An admin key is required — several metrics come from admin-wide endpoints (all users' analytics, feedback, and chats).
docker run -d \
  --name openwebui-exporter \
  -p 9090:9090 \
  --add-host host.docker.internal:host-gateway \
  -e OPENWEBUI_BASE_URL=http://host.docker.internal:3000 \
  -e OPENWEBUI_API_KEY=<your-admin-key> \
  baselhusam/open-webui-exporter:latest

curl http://localhost:9090/metrics
--add-host host.docker.internal:host-gateway lets the container reach an Open WebUI running on the host. If Open WebUI runs elsewhere, point OPENWEBUI_BASE_URL at it directly and drop the --add-host flag.
Configuration
All configuration is via environment variables:
| Variable | Default | Description |
|---|---|---|
OPENWEBUI_BASE_URL | http://localhost:3000 | Base URL of your Open WebUI instance |
OPENWEBUI_API_KEY | (required) | Admin API key |
POLL_INTERVAL_SECONDS | 30 | How often to poll the API |
EXPORTER_PORT | 9090 | Port the /metrics endpoint listens on |
MODEL_PRICES_CSV | (unset) | Path to a CSV price sheet (see Pricing) |
MODEL_PRICES_FILE | (unset) | Path to a JSON price map (alternative to CSV) |
COST_PER_1K_INPUT_TOKENS | 0 | Fallback input rate for models with no price-table entry |
COST_PER_1K_OUTPUT_TOKENS | 0 | Fallback output rate for models with no price-table entry |
The exporter is fault-tolerant: a bad API key or one unreachable endpoint increments openwebui_exporter_scrape_errors_total{endpoint=...} and sets openwebui_exporter_scrape_success to 0 — it never crashes the process.
Pricing (estimated cost)
Open WebUI reports token counts but never what a request cost, so spend is reconstructed from a per-model rate table ($ per 1M tokens) baked into the image, with published list prices for the SOTA models from OpenAI, Anthropic, Google, xAI, DeepSeek, Qwen, GLM, and Mistral. Local Ollama entries are mock prices so a local-only instance still shows a non-zero cost signal.
Override any rates without rebuilding — mount a CSV or JSON file and point an env var at it:
docker run -d \
  --name openwebui-exporter \
  -p 9090:9090 \
  -v $(pwd)/model_prices.csv:/etc/openwebui-exporter/model_prices.csv:ro \
  -e MODEL_PRICES_CSV=/etc/openwebui-exporter/model_prices.csv \
  -e OPENWEBUI_BASE_URL=http://host.docker.internal:3000 \
  -e OPENWEBUI_API_KEY=<your-admin-key> \
  --add-host host.docker.internal:host-gateway \
  baselhusam/open-webui-exporter:latest
The CSV columns and JSON format are documented in the full README.
Docker Compose (batteries included)
The repo ships compose files for the exporter alone, and for a full exporter + Prometheus + pre-provisioned Grafana stack:
git clone https://github.com/baselhusam/open-webui-exporter
cd open-webui-exporter
cp .env.example .env          # set OPENWEBUI_API_KEY

docker compose -f docker-compose.monitoring.yml up -d
# Grafana → http://localhost:3001 (dashboard auto-loaded)
Set EXPORTER_IMAGE=baselhusam/open-webui-exporter:latest in .env to pull this Docker Hub image. See the Compose section of the README for the other stacks.
Grafana dashboard
Import dashboard 25557 into any Grafana (Dashboards → New → Import, paste ID 25557, pick your Prometheus datasource). Nine sections: hero KPIs, per-user leaderboards, token economics, models & providers, model catalog & capabilities, quality & feedback, engagement & content, usage trends, and exporter self-health.
Links
- 📖 Docs & screenshots: https://baselhusam.github.io/open-webui-exporter/
- 💻 Source (GitHub): https://github.com/baselhusam/open-webui-exporter
- 📊 Grafana dashboard: https://grafana.com/grafana/dashboards/25557-open-webui/
Built by Basel Husam · MIT License
Tag summary
Content type
Image
Digest
sha256:5d6f703de…
Size
45.4 MB
Last updated
2 months ago
docker pull baselhusam/open-webui-exporter