cantara/visuale
An real-time dashboard visualisation for real-world micro-service continuous deployment environments
2.4K
cantara/visuale repository overview





Visuale
- A near real-time dashboard visualisation tool designed for visibility and control for Real-World Micro-Service Continuous Production software development processes.
Visuale is not meant to be a replacement for traditional system monitooring tools like Grafana, but an addition/extention for the important needs for Continuous Deployment/Continuous production of micro-service solutions including:
Some key unique selling points (USP)
- live and transparent reporting of the version of the service for each node for continous deployment solutions
- live insight into what services and nodes which are running in an environment
- live proactive visualisation of services and nodes which are due for security patching
- live visualization of the high availability(HA)/resilience status of the services to support fixing the problem ahead of trouble


Legend
- Battery Symbol
- The service level (SLA/HA) quality of the service. It is calculated based on the number of healthy nodes weigthed against distributed system norms
- Fuel Gauge Symbol
- If the node seems to have been running for long, meaning that its infrastructure and dependencies may be due for security patching chores
- Traffic Light Symbol
- the observed heartbeat state of the node, signalling which nodes which are not considered healthy
- Light blue PacMan Symbols
- (optional) service type icons if set and visualization turned on.
- Light blue handshake icon
- (optional) Goos Citizen symbol indicating that the service expose its own SLA Design Intention to guide clients on their expectations
Created by:
- Marius Årnes - https://github.com/appartiff - Lead Frontend Developer
- Totto - https://github.com/totto - Grunt
Test yourself
You may have a look and push data at the latest version which is reset frequently here:
Build and test from source code
$ mvn clean package
$ java -jar target/visuale.jar
$ wget http://localhost:8080/api/status
- Dashboard UI here: http://localhost:8080/
Build from IDE
The UI client is built on package stage. You must run:
$ mvn clean package
... before running Main from Intellj
Configuration
You can configure the visuale environment by creating a json file ./environment_config.json in the current directory
A simple example of a Visuale Dashboard environment configuration:
more ./environment_config.json
{
  "environment_name": "Visuale DEVTEST",
  "nodes": [
    {
      "service_name": "visuele-service",
      "node_name": "node1",
      "health_url": "https://visuale.cantara.no/health"
    },
    {
      "service_name": "visuele-service",
      "node_name": "node2",
      "health_url": "https://visuale2.cantara.no/health"
    },
....
}
If you want to override the server port, you may add a local_config.properties file
more ./local_config.properties
server.port=9292
#  default server.port=8080
server.accessToken=8fce7434-8654-11ea-bc55-0242ac130003
#  if you add this property, you have to add
#     ?accessToken=8fce7434-8654-11ea-bc55-0242ac130003 to the URL to se the dashboard
# Not real security, but will allow simple wall-mounted screens to access without too much pain


# Slack Alerting - add/update this to your slack configurations if you want status notifications from Visuale on slack
slack_alerting_enabled=true
slack_token=my slack token
slack_alarm_channel=#devtest-alerts
slack_warning_channel=#devtest-warnings
Push status to Visuale
And then you can add some push health agents:
# Let us add some dummy services by using the visuale health resurce...
JSON="`wget -qO-  http://localhost:8080/health`";wget --method=PUT --body-data="${JSON}"   http://localhost:8080/api/status/Visuale%20DEVTEST/visuale/n1
JSON="`wget -qO-  http://localhost:8080/health`";wget --method=PUT --body-data="${JSON}"   http://localhost:8080/api/status/Visuale%20DEVTEST/visuale/n2
JSON="`wget -qO-  http://localhost:8080/health`";wget --method=PUT --body-data="${JSON}"   http://localhost:8080/api/status/Visuale%20DEVTEST/visuale/n3
Json body
{
  "Status": "OK",
  "name": "Jenkins",
  "version": "2.222",
  "ip": "172.31.34.121 "
}
Path http://localhost:8080/api/status//visuale/
Additional grouping and organisation of services
We support two mechanisms to organize services: servive_tag and service_type which can be set from the environment_config.json file or by adding query parameters to the /api/status call like
-
?service_type=CS&service_tag=QoS_Group_A
Using tags to further organise the services
We have added an optional property to a service called service_tag which can be configured in environment_config.json on the node or can be added as a query parameter ?service_tag=asia on the PUT reporting. On setups with tags, we support two additional UI visualizations:
- groupByTag
- groupByService
Which can be seen in the dashboard with
- ?ui_extension=groupByService or
- ?ui_extension=groupByTag
on the URL of the UI to support additional service grouping views.
Note: TAGS are not case-sensitive in Visuale.
https://visuale.cantara.no/?ui_extension=groupByTag example

groupByService example
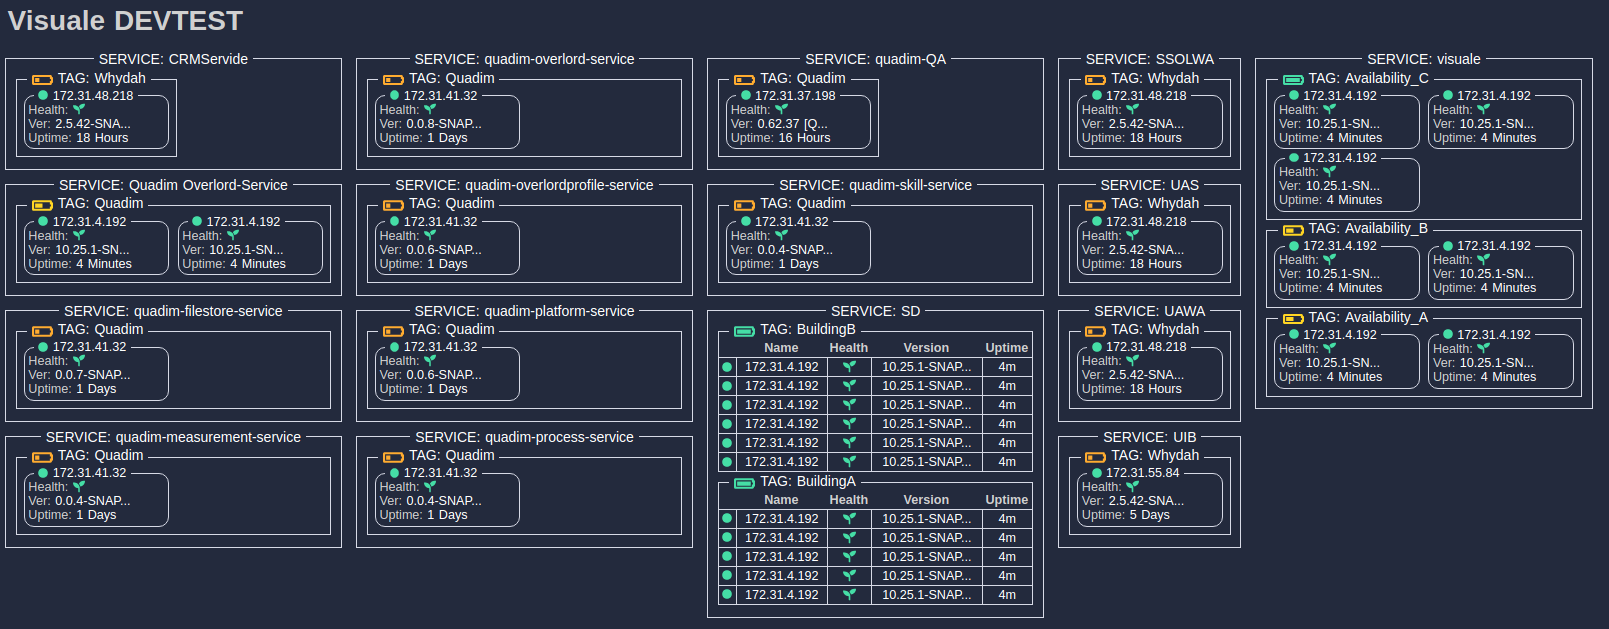
Visualizing the type of services running in the Dashboard
Visuale support categorization of services into types of services. This can be added to the service with the additional service_type parameter (both as a query-parameter on PUT health updates or in the environment json configuration. The visualization of service categories is switched on by the following query parameter for the dashboard:
- &servicetype=true
As of the initial release, Visuale support the Cantara Service Categorization (https://wiki.cantara.no/display/OWSOA/Service+Categories), but we may add support for installation spesific service categorization if enough people want this.
Some initial key targets for the project
-
:heavy_check_mark: the UI should mainly be a static UI meant for big-surveilance screens on the walls...
-
:heavy_check_mark: the UI should be continuously updating...
-
:heavy_check_mark: semantic version, running since and some instance info like internal IP are the most important values....
-
:heavy_check_mark: service indicator of the service live resillience/availabillity
-
:heavy_check_mark: a dashboard which display each service (and each service node) with cached/real info ie like what the /health and/or /info endpoint for each service produce.....
-
:heavy_check_mark: the "cluster" instances should be grouped as a service...
-
:heavy_check_mark: dashboard service...initial version will be open, i.e. not need any auth...
-
:heavy_check_mark: old/long running services (>7 days) should be marked as insecure/vulnerable due to lack of patching
-
:heavy_check_mark: mobile friendly - so you can check your environments on the bus on the way to work
-
:heavy_check_mark: nodes which have not reported for 10 intervals should be marked with a yellow "not working properly" colour...
-
:heavy_check_mark: nodes which are not reachable or have missed 50 updates should be marked red/dead...
-
:heavy_check_mark: we will support both pull-based info... and pod/instance CRON jobs which push the health json to the
-
:heavy_check_mark: normal update interval from the service should be 5 or 10 second
-
:heavy_check_mark: it might support clicking into a service or a node to see all the details...
-
:heavy_check_mark: The backend should attempt to do some simple semantic mapping for different json health structures
Docker
cd Docker

# Build
sudo docker build -t visuale .

# Run
sudo docker run --rm -p 8080:8080 visuale:latest

# Test - view applocation
wget //http://localhost:8080/

# Let us add some dummy services by using the visuale health itself...
JSON="`wget -qO-  http://localhost:8080/health`";wget --method=PUT --body-data="${JSON}"   http://localhost:8080/api/status/env_devtest/visuale/n1
JSON="`wget -qO-  http://localhost:8080/health`";wget --method=PUT --body-data="${JSON}"   http://localhost:8080/api/status/env_devtest/visuale/n2
JSON="`wget -qO-  http://localhost:8080/health`";wget --method=PUT --body-data="${JSON}"   http://localhost:8080/api/status/env_devtest/visuale/n3
JSON="`wget -qO-  http://localhost:8080/health`";wget --method=PUT --body-data="${JSON}"   http://localhost:8080/api/status/env_devtest/visuale/n4

# Observe the UI gets updated with a new visuale cluster...
- Dashboard: http://localhost:8080/
- DockerHub: https://hub.docker.com/r/cantara/visuale
Some simple agent scripts to push health to visuale
Installation og cron/scripted agent:
wget https://raw.githubusercontent.com/Cantara/visuale/master/agent/scripts/download_and_setup_visuale_reporting.sh
chmod 755 ./download_and_setup_visuale_reporting.sh
./download_and_setup_visuale_reporting.sh
- Edit ./scripts/reportServiceHealthToVisuale.properties to your needs
- Set up cron-job to run the script
cd .
ln -s scripts/CRON MY_VISUALE_AGENT_CRON
crontab MY_VISUALE_AGENT_CRON
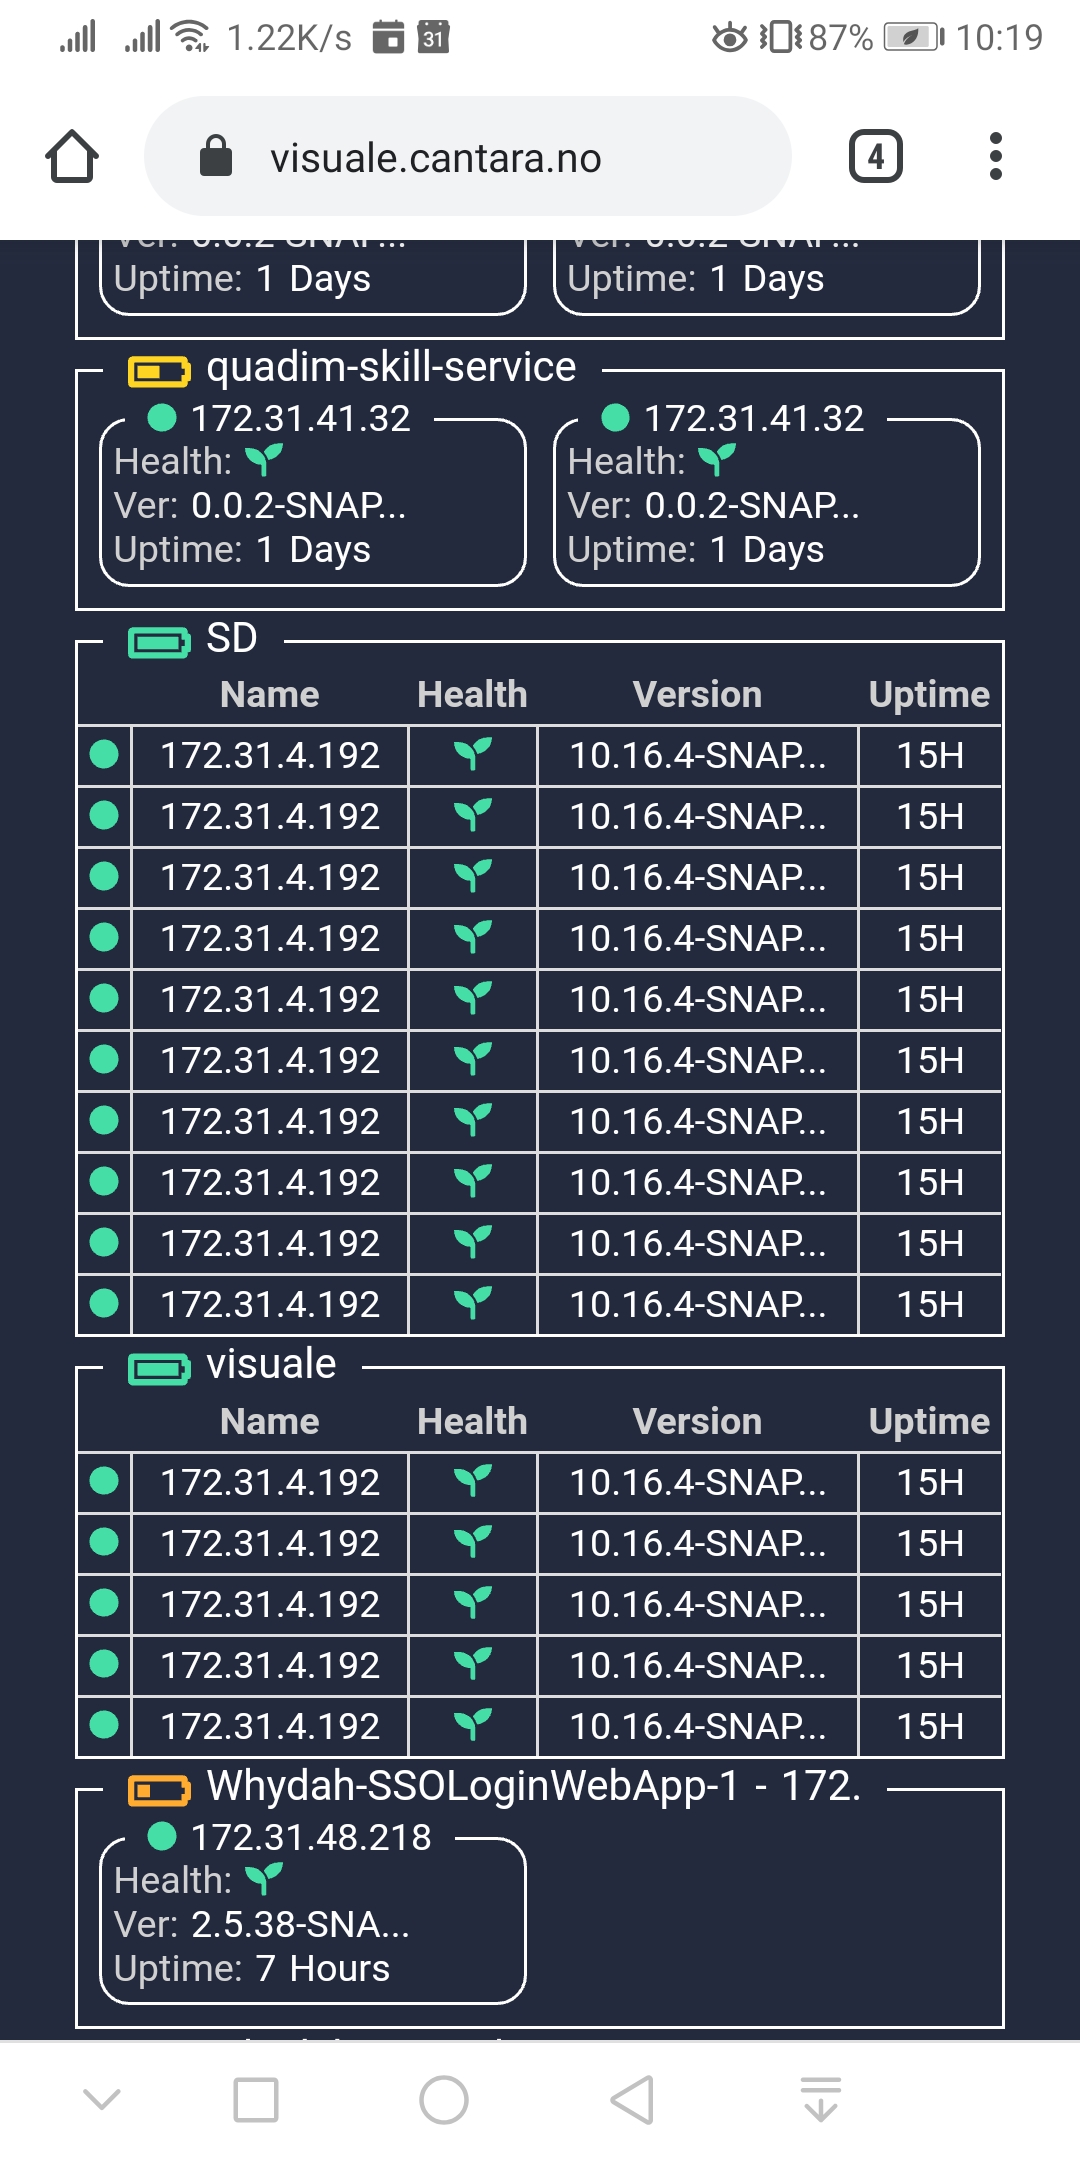
Visuale on mobile phones
And if you thought Visuale was only for wall-mounted dashboards, you are wrong:). We know that time is urgent, so you can check the status off all your environments conveniently on your phone on your way to work.
Tag summary
Content type
Image
Digest
Size
239.5 MB
Last updated
about 5 years ago
docker pull cantara/visuale