drumsergio/duplicacy-exporter repository overview





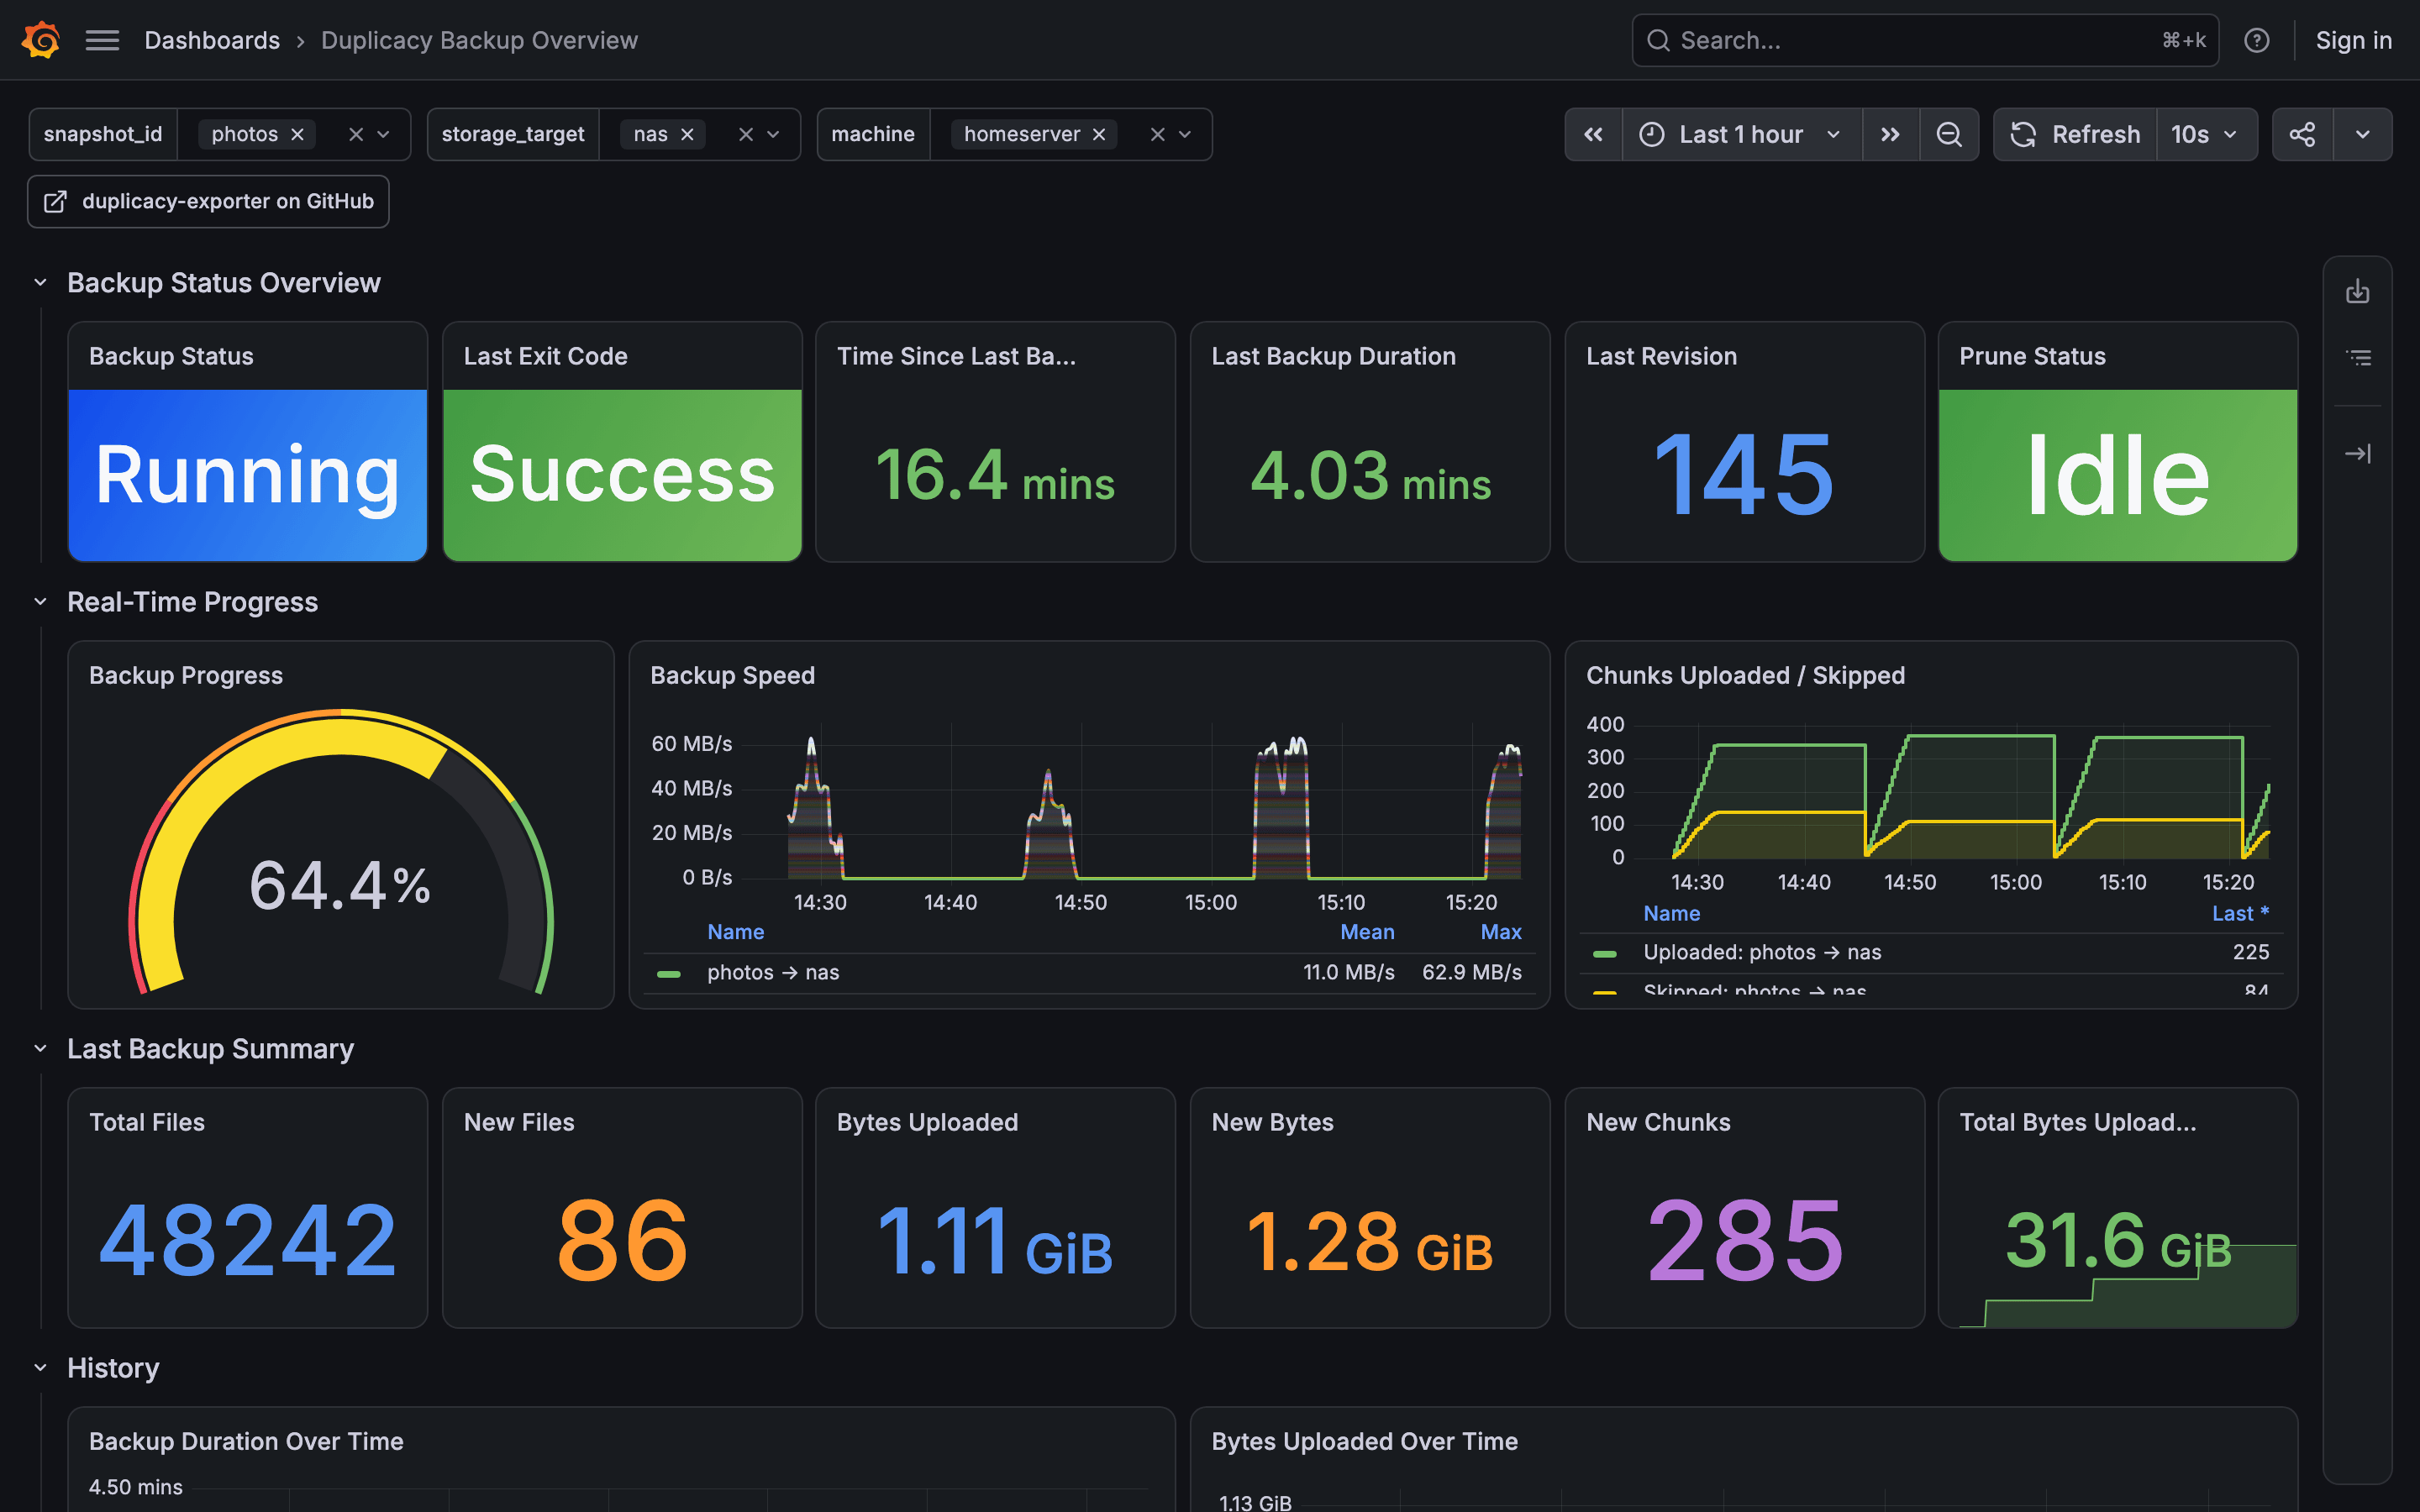
duplicacy-exporter is a Prometheus exporter for Duplicacy backups. It reads the CLI's log or receives the Web UI's report, and exposes progress and speed while a backup runs and the summary when it ends: duration, files, bytes uploaded, exit code and revision, per snapshot, storage and machine. Duplicacy on its own writes logs and sends email, so nothing tells you that last night's backup failed or that one has not run for three days; with the exporter, Prometheus alerts on both and the shipped Grafana dashboard shows every backup on every machine in one place.
Features
- Watch a backup run: progress, upload speed and chunks uploaded or skipped move on every chunk line of a CLI log that carries section headers.
- Know how every backup ended: duration, files, bytes uploaded, exit code and revision number, per snapshot, storage target and machine.
- Alert on a failed or a stale backup with the two Prometheus rules in the docs.
- Know when the last prune finished, from CLI logs.
- Two inputs:
log_tailfor the CLI, from a log file or a container's logs, andwebhookfor the Web UI'sreport_url. - Readable labels: snapshot id, storage target and machine name come from the log, and IPs or Tailscale names map to names you choose.
- Values survive a restart: the last completed run is saved to disk and served again on start, so dashboards and Home Assistant sensors never go blank on an upgrade.
- Storage size and revision counts from an optional poller that runs the bundled duplicacy CLI.
- A ready-made Grafana dashboard (#25089).
- One Python file, one dependency, a 39 MB image for amd64 and arm64, or
pipx install duplicacy-exporter.
Quick start
Pick the line for your Duplicacy, then check it.
# Duplicacy Web UI: receive the report it posts when a backup ends
docker run -d --name duplicacy-exporter -p 9750:9750 -e MODE=webhook \
  -v duplicacy-exporter-data:/data drumsergio/duplicacy-exporter:0.6.0
# Duplicacy CLI: tail the log your backup job writes
docker run -d --name duplicacy-exporter -p 9750:9750 -e MODE=log_tail \
  -e LOG_FILE=/logs/duplicacy.log -e MACHINE_NAME=$(hostname) -e SNAPSHOT_ID=my-snapshot \
  -v /path/to/duplicacy/logs:/logs:ro -v duplicacy-exporter-data:/data drumsergio/duplicacy-exporter:0.6.0
curl -s localhost:9750/health
curl answers OK, backup series appear on /metrics after the first run ends, and live progress needs the --- Backup -> Primary (<id>) --- headers that duplicacy-cli-cron writes (a plain duplicacy backup log gives the summary only). For the Web UI, set report_url to http://<address of this host>:9750/webhook, because the Web UI container cannot resolve the exporter's container name unless both share a Docker network. Port 9750 has no authentication and /webhook is open in every mode, so publish it only to a network you trust. Then add :9750/metrics to Prometheus and import dashboard 25089; Getting started has the compose files, the PyPI install and the first check.
Documentation
The full documentation is at geiserx.github.io/duplicacy-exporter.
- Get started: Getting started, Usage, Prometheus and Grafana
- Reference: Configuration, Metrics, Webhook payload, Storage poller
- Help: How it works, Troubleshooting, Related projects
- Development: tests, docs build, release
Open an issue for bugs and questions, with the exporter's log at LOG_LEVEL=DEBUG. Report security problems through the security policy, never in a public issue.
Related projects
duplicacy-container (image and Helm chart), duplicacy-cli-cron (scheduled CLI backups whose log this exporter reads), duplicacy-ha (Home Assistant sensors from /metrics), duplicacy-mcp (MCP server).
License
Tag summary
Content type
Image
Digest
sha256:9cac86a80…
Size
39.9 MB
Last updated
about 21 hours ago
docker pull drumsergio/duplicacy-exporter