edgeimpulse/ei-transform_create-graphs-in-file repository overview
Create graphs from CSV
This transformation block generates graphs from sensor CSV files.
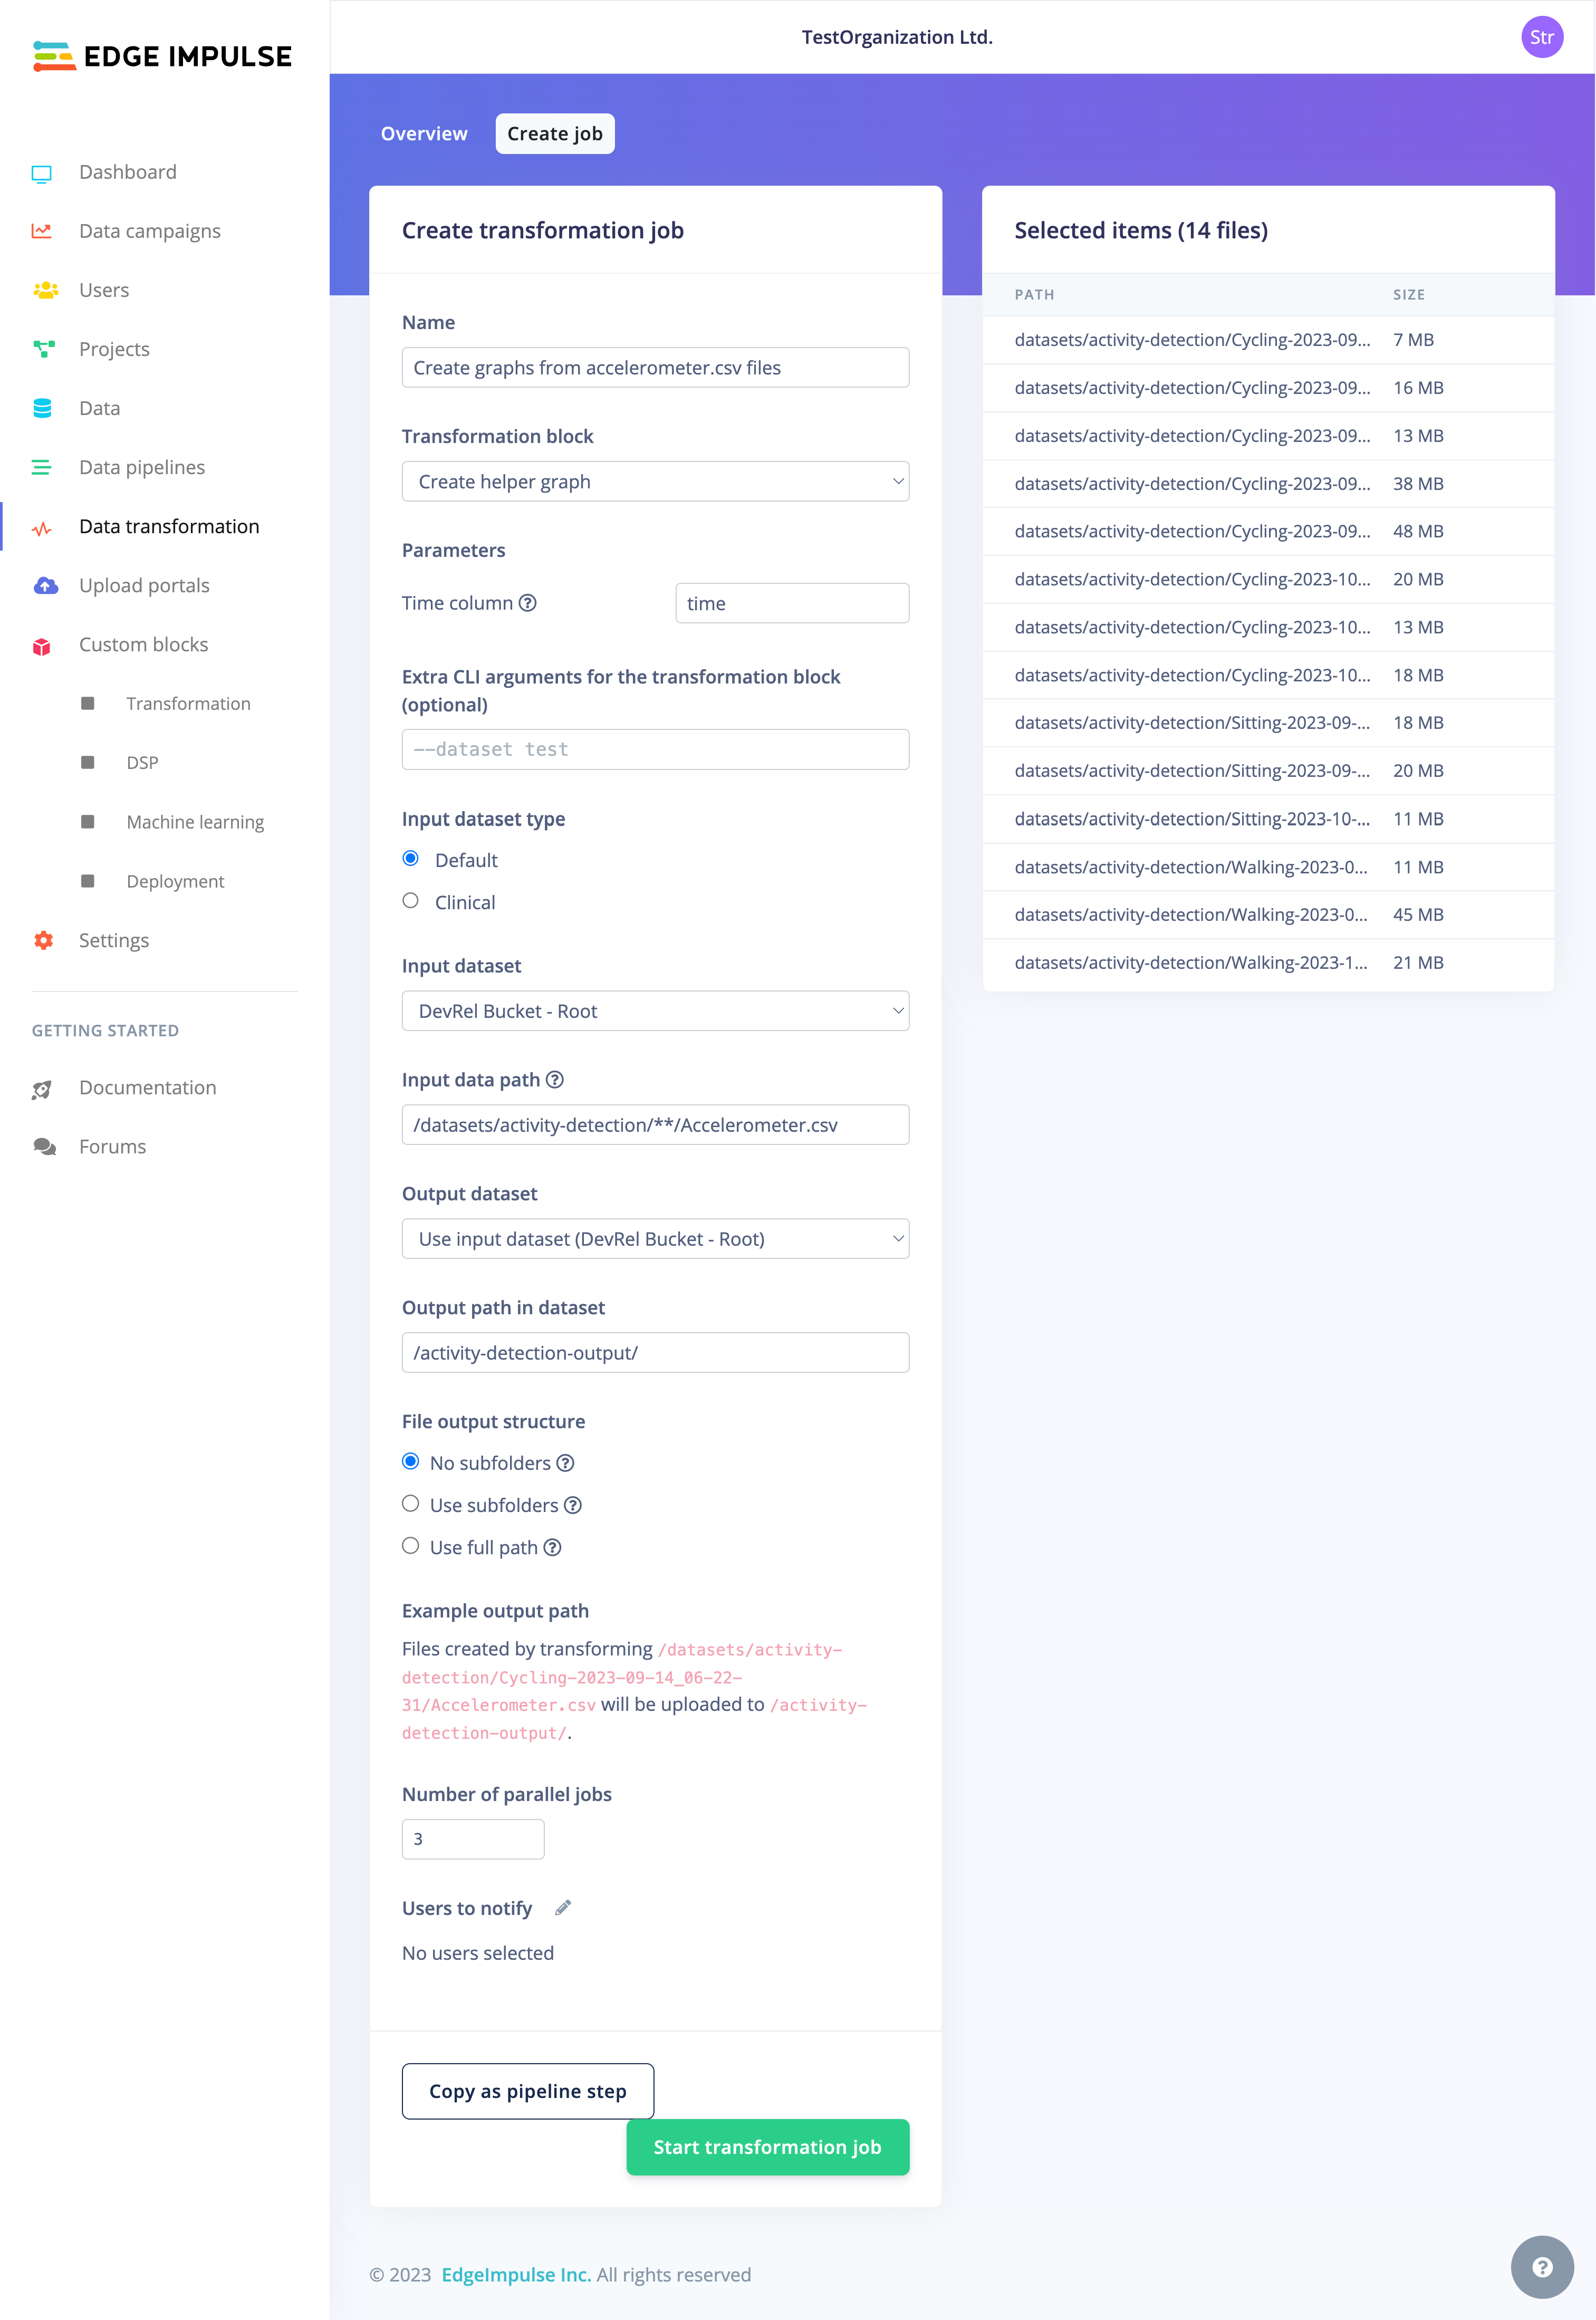
Setup
Operating mode: File (--in-files)
Parameters:
[
    {
        "name": "Time column",
        "type": "string",
        "param": "time-column",
        "value": "time",
        "help": "Time column that will be used as for the x-axis"
    }
]
Test the transformation block locally
The dataset used to test this transformation is accessible here: https://www.kaggle.com/datasets/luisomoreau/activity-detection.
pip3 install -r requirement.txt
python3 transform.py --in-file input/Accelerometer.csv --out-directory output --time-column time
The output graph will look like the following:
- Accelerometer.csv:
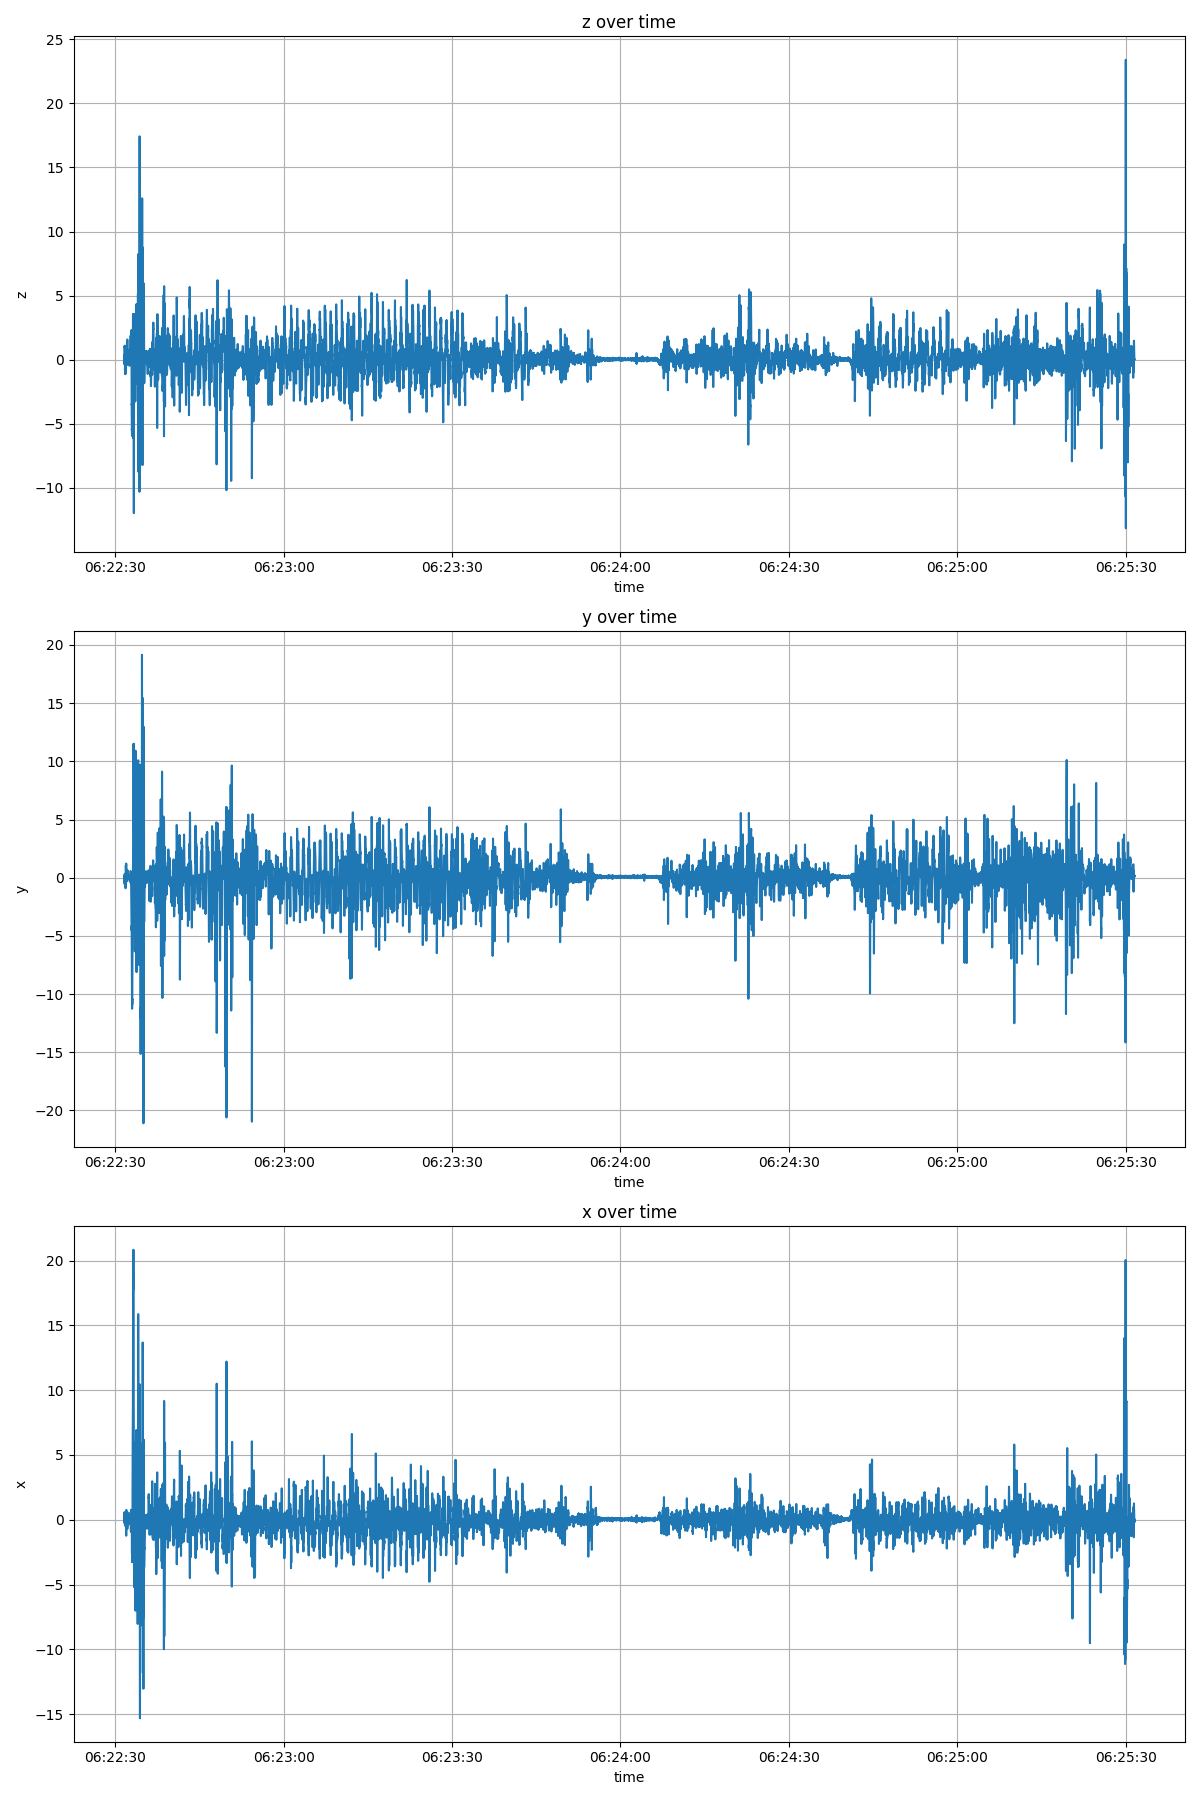
- Location.csv:

Tag summary
Content type
Image
Digest
sha256:f535de7bd…
Size
450.1 MB
Last updated
over 2 years ago
docker pull edgeimpulse/ei-transform_create-graphs-in-file