giiibates/crowdsec-toolbox
597
giiibates/crowdsec-toolbox repository overview

Turn CrowdSec decisions into action and insight




Abuse reporting · Metrics export · Dashboards · License
CrowdSec can identify and block hostile traffic. CrowdSec Toolbox helps you use those decisions after they are made: send an abuse report to the responsible network contact, or export decision data to the time-series backend you already monitor. Each tool is independent, so you can run only the part you need.
Features at a glance
| crowdsec-abuse-reporter | crowdsec-metrics-exporter | |
|---|---|---|
| What it does | Turns CrowdSec bans into abuse reports | Exports CrowdSec decisions as time series |
| 📥 Source | CrowdSec Local API (LAPI), direct | CrowdSec Local API (LAPI), direct |
| 📤 Output | X-ARF v4 email to the responsible abuse contact | InfluxDB 2.x or QuestDB (line protocol over HTTP) |
| 🌍 Enrichment | GeoIP (GeoLite2 City + ASN) | — |
| 📇 Contact lookup | Abusix DNS abuse-contact database | — |
| 🔁 Idempotency | SQLite, at-most-once per (AlertId, IPAddress) | Backend-side deduplication, no local state |
| 🐳 Runs as | Docker container (own image), or cron/host script | Docker container, or cron/host script |
| 📦 Dependencies | httpx, dnspython, geoip2 | requests, urllib3, httpx |
Grafana dashboards
Both tools ship ready-made dashboards in their grafana/ directory — import the
JSON, pick your data source, and you have a working view of what CrowdSec is
blocking. No provisioning, no plugins beyond the data source itself.
| Dashboard | Panels | Highlights | |
|---|---|---|---|
| Metrics export | dashboard_questdb.json | 18 | World map of source IPs coloured per host, alert and event history, top countries, networks/ASN, scenarios, source IPs, and — with the per-event export enabled — top endpoints and target FQDNs |
| Abuse reporting | dashboard_questdb.json | 8 | A four-card KPI header (sent, failed, success rate, total), daily reports, top recipients, origin countries, and a paginated detail table |
Country values render as flag emoji, and hosts keep a stable colour across panels. The shared host and scenario filters apply throughout; the country filter applies to every panel except the two event panels, whose table holds no geo columns.
Screenshots
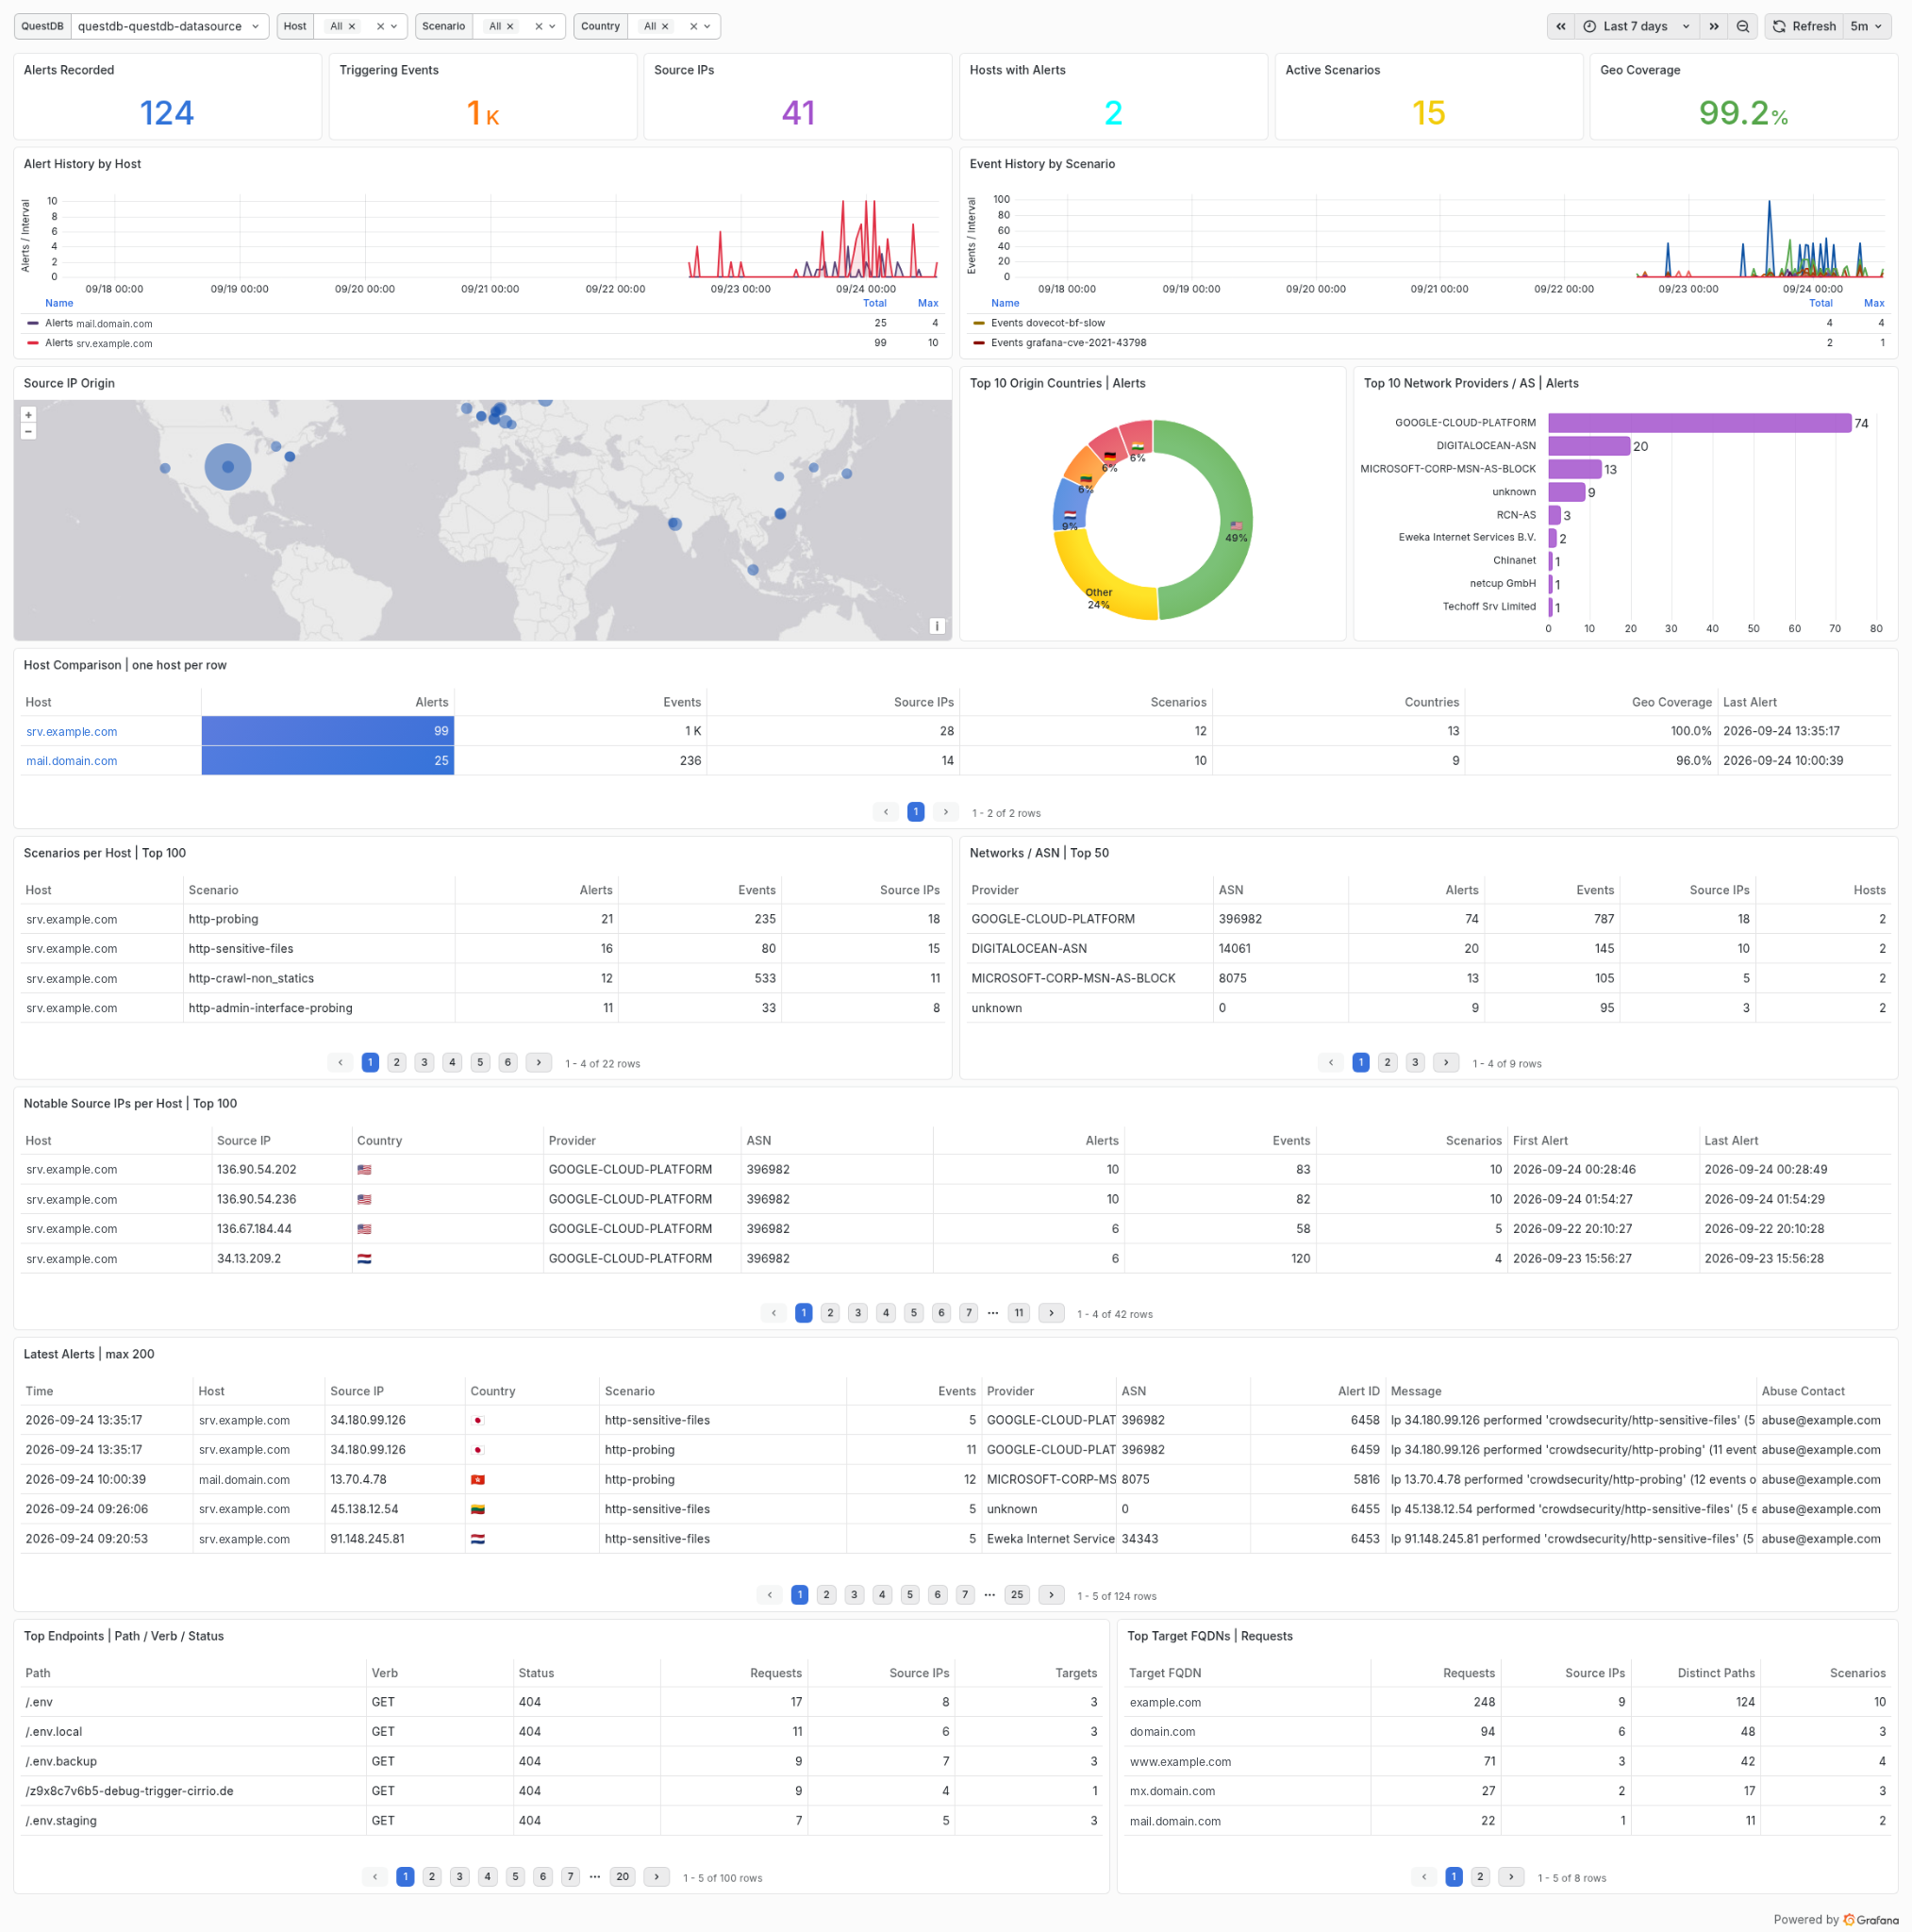
Note
Both dashboards are developed and tested against **Grafana 13** using the v2 dashboard schema (`dashboard.grafana.app/v2`). Grafana validates that schema on import, so an older release will reject them. The metrics dashboard targets the [QuestDB data source plugin](https://grafana.com/grafana/plugins/questdb-questdb-datasource/); the InfluxDB variants are placeholders.
Deployment
Both tools provide Docker and Compose deployments. The metrics exporter can also
run directly as a Python script on the CrowdSec host. They have separate entry
points and their own pyproject.toml dependency manifests, so their
deployments can be managed independently. Follow each tool's README for setup,
configuration, and operating notes.
Important
*CrowdSec Toolbox* is an independent community project. It is not affiliated with, endorsed by, or sponsored by CrowdSec.
License
This repository is released under the MIT License.

Tag summary
Content type
Image
Digest
sha256:4c41593c1…
Size
44.8 MB
Last updated
13 days ago
docker pull giiibates/crowdsec-toolbox:metrics-exporter-latest