jorgecardona/datascience
Python C++ Go Java Julia Node Kotlin R Rust Scala PySpark Kafka Beam Scikit Dask DBT Airflow Jenkins
Image
0
10K+
jorgecardona/datascience repository overview
Jorge Cardona



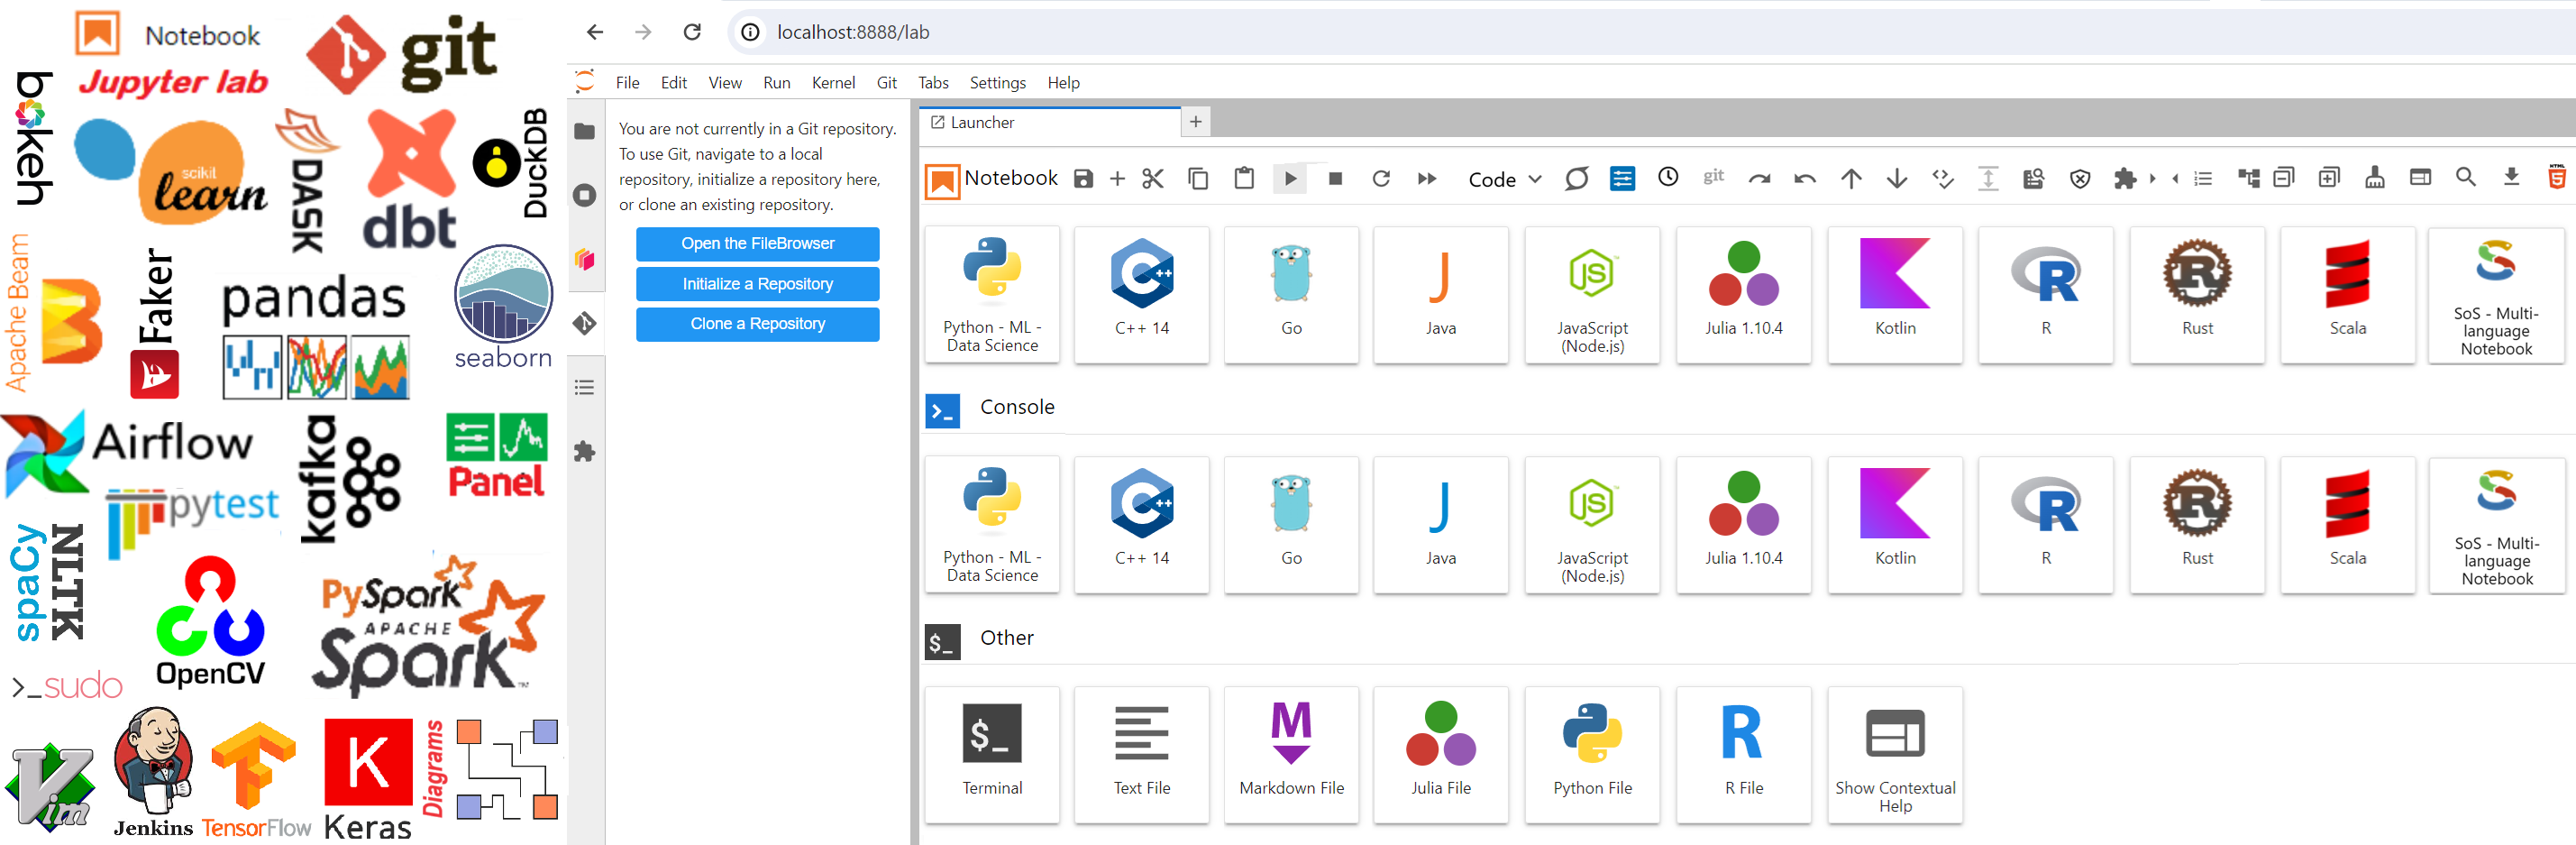
Available Kernels, Languages And Packages
❎ In a python cell run the following code to check the version of each installed language ❎
%%bash
echo "C++ Version" && g++ --version && echo
echo "Go Version" && go version && echo
echo "Java Version" && java -version && echo
echo "NodeJs Version" && node -v && echo
echo "Kotlin Version" && kotlin -version && echo
echo "Python Version" && python --version && echo
echo "R Version" && R --version && echo
echo "Rust Version" && rustc --version && echo
echo "Scala Version" && scala -version && echo
echo "Julia Version" && julia -version && echo
⚠️ For this image, it is not necessary to use the token to access the notebooks ⚠️
How to run the image.
TEMPORAL CONTAINER
🔥If you want to just test the image and do not keep the container when you finish running the container use the next command🔥:
docker run --name jorgecardona-datascience --rm -p 8888:8888 -p 4040:4040 -p 5006:5006 -p 3000:3000 -p 8081:8081 -p 8082:8082 -p 8083:8083 -p 9091:9091 -p 9092:9092 -p 9093:9093 -p 9094:9094 jorgecardona/datascience:main
PERSISTENT CONTAINER
💦If you want to keep the container, save the notebooks, and continue working on this container use the next command:💦
docker run --name jorgecardona-datascience -p 8888:8888 -p 4040:4040 -p 5006:5006 -p 3000:3000 -p 8081:8081 -p 8082:8082 -p 8083:8083 -p 9091:9091 -p 9092:9092 -p 9093:9093 -p 9094:9094 --restart always jorgecardona/datascience:main
ACCESS TO JUPYTER LAB AND SPARK UI
🐱 access to JUPYTERLAB http://localhost:8888 CLICK HERE 🐱
🐶access to sparkUI with pySpark http://localhost:4040 CLICK HERE 🐶
🌀To run Spark for Scala, on the terminal execute spark-shell command to start it.🌀

🐍access to sparkUI Running directly Apache Spark http://localhost:4040 CLICK HERE 🐍

EXAMPLES BY LANGUAGE
| Language | Example |
|---|---|
| C++ | #include <iostream> int calculateSquare(int number) { return number * number; } int main() { // Print "Hello, C++!" std::cout << "Hello, C++!" << std::endl; // Use the function to calculate the square of 5 int result = calculateSquare(5); // Print the result std::cout << "The square of 5 is: " << result << std::endl; return 0; } |
| Go | package main import "fmt" func main() { fmt.Println("Hello, Go!") // Define a function to calculate the square of a number calculateSquare := func(number int) int { return number * number } // Use the function to calculate the square of 5 result := calculateSquare(5) fmt.Println("Square of 5:", result) } main() |
| Java | public class Main { public static void greeting() { System.out.println("Hello, Java!"); } } Main.greeting(); |
| Node.js | const http = require('http'); // Create the server const server = http.createServer((req, res) => { // Configure the server response res.statusCode = 200; res.setHeader('Content-Type', 'text/plain'); res.end('Hello, from JupyterLab Container!'); }); // Define the port on which the server will run const port = 3000; // Start the server server.listen(port, () => { console.log('Node.js server is running at http://localhost:' + port + '/'); }); |
| Kotlin | fun main() { // Print "Hello, Kotlin!" println("Hello, Kotlin!") // Define a function to calculate the square of a number fun calculateSquare(number: Int): Int { return number * number } // Use the function to calculate the square of 5 val result = calculateSquare(5) println("Square of 5: $result") } main() |
| R | # Print "Hello, R!" cat("Hello, R!\n") # Define a function to calculate the square of a number calculateSquare <- function(number) { return (number * number) } # Use the function to calculate the square of 5 result <- calculateSquare(5) cat("Square of 5: ", result, "\n") |
| Rust | fn main() { // Print "Hello, Rust!" println!("Hello, Rust!"); // Define a function to calculate the square of a number fn calculate_square(number: i32) -> i32 { return number * number; } // Use the function to calculate the square of 5 let result = calculate_square(5); println!("Square of 5: {}", result); } main() |
| Scala | println("Hello, Scala!") // Define a function to calculate the square of a number def calculateSquare(number: Int): Int = { number * number } // Use the function to calculate the square of 5 val result = calculateSquare(5) // Print the result println("The square of 5 is: " + result) |
| Julia | print("Hello Julia!\n") # Define a function to calculate the square of a number function square(number::Int) return number * number end # Use the function to calculate the square of 5 num = 5 # Print the result println("The square of ", num, " is ", square(num)) |
Relevant Packages & Installed Apps
| Package | Version | Port |
|---|---|---|
| Apache Spark UI | 3.4.3 | 4040 |
| Node.js | 18.13.0 | 3000 |
| Kafka | 3.6.1 | 9091-9094 |
| Panel | 1.3.8 | 5006 |
| jupyterlab | 4.0.16 | 8888 |
| dbt-docs server | 1.7.4 | 8081 |
| apache-airflow | 2.8.0 | 8082 |
| jenkins | 2.440.2 | 8083 |
| pyspark | 3.4.3 | 4040 |
| confluent-kafka | 2.3.0 | |
| jupyterlab-git | 0.50.0 | |
| pandas | 2.2.2 | |
| apache-beam[interactive] | 2.55.1 | |
| dask | 2024.1.0 | |
| duckdb | 0.9.2 | |
| scikit-learn | 1.4.0 | |
| OpenCV Python | 4.9.0.80 | |
| Spacy | 3.7.2 | |
| NLTK | 3.8.1 | |
| bokeh | 3.3.4 | |
| seaborn | 0.13.2 | |
| dbt-core | 1.7.4 | |
| mysql-connector-python | 8.3.0 | |
| psycopg2 | 2.9.9 | |
| pymongo | 4.6.1 | |
| Faker | 22.5.1 | |
| itables | 1.6.3 | |
| pytest | 8.0.0 | |
| diagrams | 0.23.4 | |
| jupyterlab_code_formatter | 2.2.1 | |
| black | 24.1.2 | |
| isort | 5.13.2 | |
| autopep8 | 2.1.0 | |
| yapf | 0.40.2 | |
| pycodestyle | 2.11.1 | |
| jupyterlab-indent-guides | 0.1.0 | |
| jupyterlab-lsp | 5.1.0 | |
| python-language-server | 0.36.2 | |
| AnsiColorPrinter | 0.0.2 | |
| Pyxtension | 1.16.10 | |
| delta-spark | 2.4.0 |
EXAMPLES OF INSTALLED PACKAGES
🐳 Test Basic Packages Notebook GUIDE CLICK HERE 🐳
You can use the following examples for testing, just copy and paste the following code to test each package.
| Package | Description | Advantages | Disadvantages | Example |
|---|---|---|---|---|
| Itables | tabular data manipulation in Python. | SQL-like syntax for querying. | May be less efficient for advanced operations compared to specialized libraries. | # to enable itables from itables import init_notebook_mode init_notebook_mode(all_interactive=True) |
| Pyspark | distributed processing with Apache Spark | - Distributed and scalable processing | - Complex configuration and management | from pyspark.sql import SparkSession # Create a SparkSession spark = SparkSession.builder.appName("JorgeCardonaSpark").getOrCreate() # Perform a simple DataFrame operation data = [('Nathalie', 0), ('Ana', 3), ('Diana', 7), ('Lucia', 10), ('Tatiana', 13), ('Angela', 17), ('Cecilia', 25), ('Alice', 31), ('Kristin', 35), ('Carolina', 37), ('Lina', 39), ('Marcela', 40), ('Maria', 42)] # Create a Dataframe df = spark.createDataFrame(data, ["Name", "Age"]) df.show() spark.stop() |
| Pandas | data manipulation and analysis | - Efficient data manipulation and analysis functions | - Limitations in handling large volumes of data | import pandas as pd data = { 'Name': ["Nathalie", "Ana", "Diana", "Lucia", "Tatiana", "Angela", "Cecilia", "Alice", "Kristin", "Carolina", "Lina", "Marcela", "Maria"], 'Age': [0, 3, 7, 10, 13, 17, 25, 31, 35, 37, 39, 40, 42] } df = pd.DataFrame(data) df |
| Apache-beam | Programming model for data processing | - High-level abstraction for data processing | - Requires knowledge of parallel programming | import apache_beam as beam def regular_case_function(element): return element.lower() def to_uppercase_function(element): return element.upper() def calculate_length_function(element): return len(element) def calculate_square_function(element): return element ** 2 # Create a pipeline with beam.Pipeline() as pipeline: # Prepare a list of names to be processed names_list = ["Nathalie", "Ana", "Diana", "Lucia", "Tatiana", "Angela", "Cecilia", "Alice", "Kristin", "Carolina", "Lina", "Marcela", "Maria"] # Create a PCollection with the given data data = pipeline | beam.Create(names_list) # Apply transformation functions to the data regular_case_data = data | beam.Map(regular_case_function) # Transform to lowercase uppercase_data = data | beam.Map(to_uppercase_function) # Transform to uppercase length_data = data | beam.Map(calculate_length_function) # Apply transformation to calculate the length of each name square_data = length_data | beam.Map(calculate_square_function) # Apply transformation to calculate the square # Print the results of each transformation length_data | "Show_Length" >> beam.Map(print) # Print length results regular_case_data | "Show_Lowercase" >> beam.Map(print) # Print lowercase results uppercase_data | "Show_Uppercase" >> beam.Map(print) # Print uppercase results square_data | "Show_Square" >> beam.Map(print) # Print square results combined_data = (length_data, regular_case_data, uppercase_data, square_data) | beam.Flatten() combined_data | "Show_All" >> beam.Map(print) |
| Faker | Generating simulated data | - Easy generation of simulated data | - Not suitable for production environments | from faker import Fakerfake = Faker()name = fake.name()print(name) |
| Panel | Creating interactive dashboards and apps | - Powerful dashboard and app creation capabilities | - Requires learning the Panel library | import panel as pn def model(n=5): return "⭐"*n pn.extension() slider = pn.widgets.IntSlider(value=5, start=1, end=5) interactive_model = pn.bind(model, n=slider) layout = pn.Column(slider, interactive_model) app = pn.serve(layout, port=5006, show=True) #app.stop() # ✨ Panel UI APP http://localhost:5006 CLICK HERE ✨ |
| Seaborn | Data visualization library based on Matplotlib | - Easy syntax for creating attractive statistical graphics | - May not be as customizable as Matplotlib | import seaborn as sns import matplotlib.pyplot as plt # Load the "tips" dataset from Seaborn tips = sns.load_dataset("tips") # Create a scatter plot with Matplotlib plt.figure(figsize=(10, 7)) plt.scatter(x='total_bill', y='tip', data=tips, alpha=0.7) plt.title('Scatter Plot of Total Bill vs Tip') plt.xlabel('Total Bill') plt.ylabel('Tip') plt.show() |
| Bokeh | Interactive visualization library | - Interactive and web-ready visualizations | - Learning curve for advanced features | from bokeh.plotting import figure, show from bokeh.io import output_notebook import seaborn as sns # Load the "tips" dataset from Seaborn tips = sns.load_dataset("tips") # Enable output in the notebook output_notebook() # Create a scatter plot using Bokeh with custom size p = figure( title="Scatter Plot of Total Bill vs Tip", x_axis_label='Total Bill', y_axis_label='Tip', width=900, # adjust as needed height=500 # adjust as needed ) # Add the data to the plot p.circle(x='total_bill', y='tip', source=tips, size=8, color="navy", alpha=0.5) # Show the plot in the notebook show(p) |
| Package Diagrams | Drawing package diagrams | - Provides a simple and intuitive way to create package diagrams | - Limited customization options | from diagrams import Diagram from diagrams.aws.compute import EC2 from diagrams.aws.database import RDS from diagrams.aws.network import ELB with Diagram("Grouped Workers", show=False, direction="TB"): ELB("lb") >> [ EC2("worker1"), EC2("worker2"), EC2("worker3"), EC2("worker4"), EC2("worker5") ] >> RDS("events") |
| AnsiColorPrinter | A Python package for printing text in various ANSI colors. | Easy-to-use functions for colorizing text. | Limited functionality compared to others. | import AnsiColorPrinter as acp # Print red text print(acp.red("Hello, World!")) # Print bold blue text print(acp.blue("Welcome!", formats=["bold"])) # Print bold red multiple formats print(acp.cyan("Multi Formats", formats=['underlined', 'bold', 'reverse'])) |
| Pyxtension | A Python package providing extended functionality and tools. | Simplifies common data manipulation tasks. | May have a learning curve for beginners. | from pyxtension.streams import streamdata = [{'name': 'Alice', 'age': 28, 'gender': 'F'},{'name': 'Bob', 'age': 23, 'gender': 'M'},{'name': 'Charlie', 'age': 35, 'gender': 'M'},{'name': 'David', 'age': 22, 'gender': 'M'},{'name': 'Eve', 'age': 30, 'gender': 'F'},{'name': 'Frank', 'age': 26, 'gender': 'M'},{'name': 'Grace', 'age': 29, 'gender': 'F'},{'name': 'Hank', 'age': 31, 'gender': 'M'},{'name': 'Ivy', 'age': 24, 'gender': 'F'},{'name': 'Jack', 'age': 27, 'gender': 'M'}]print(stream(data).filter(lambda person: person['age'] > 25).map(lambda person: person['name']).toList())print(stream(data).map(lambda person: person['age']).toList())print(stream(data).map(lambda person: person['age']).mean())print(stream(data).min(lambda person: person['age'])['name'])print(stream(data).map(lambda person: {'name': person['name'].upper(), 'age': person['age'], 'gender': person['gender']}).toList())print(stream(data).map(lambda person: person['name']).join(", "))print(stream(data).sorted(key=lambda person: person['age']).toList())print(stream(data).map(lambda person: person['age']).sum())print(len(stream(data).filter(lambda person: person['age'] > 30).toList()))print(dict(stream(data).map(lambda person: (person['name'], person['age'])).toList()))print(stream(data).filter(lambda person: person['age'] > 25).filter(lambda person: 'c' in person['name'].lower()).map(lambda person: person['gender']).reduce(lambda acc, gender: {**acc, gender: acc.get(gender, 0) + 1}, {})) |
ADDED SUPPORT TO CONNECT SPARK FOR EXTRACTION DATA FROM MySQL, MongoDB, AND PostgreSQL
PING to databases MySQL, MongoDB, PostgreSQL
USE TEMPORAL DOCKER IMAGES FOR TESTING, delete --rm on docker command to do persistent databases
DOCKER FOR PostgreSQL
docker run --name jorgecardona-postgres --rm -e POSTGRES_DB=spark -e POSTGRES_PASSWORD=12345678 -e POSTGRES_USER=admin -d -p 5432:5432 postgres:15.4
DOCKER FOR MySQL
docker run --name jorgecardona-mysql --rm -e MYSQL_DATABASE=spark -e MYSQL_PASSWORD=12345678 -e MYSQL_USER=admin -e MYSQL_ROOT_PASSWORD=root -d -p 3306:3306 mysql:8.4.0
DOCKER FOR SQL SERVER
user: sa
pass: Admin@123
docker run --name jorgecardona-sqlserver -d --rm -e "ACCEPT_EULA=Y" -e "MSSQL_SA_PASSWORD=Admin@123" -e "MSSQL_DATA_DIR=/var/opt/mssql/data" -e "MSSQL_PID=Developer" -e "MSSQL_TCP_PORT=1433" -p 1433:1433 --hostname jorgecardona-sqlserver mcr.microsoft.com/mssql/server:2022-latest
DOCKER FOR MongoDB
docker run --name jorgecardona-mongodb --rm -d -p 27017:27017 -e MONGO_INITDB_ROOT_USERNAME=admin -e MONGO_INITDB_ROOT_PASSWORD=12345678 mongodb/mongodb-community-server:6.0.7-ubuntu2204-20230812T065949Z
STRING CONNECTION FOR SPECIFIC MONGO DB HOST
mongodb://admin:12345678@localhost:27017
STRING CONNECTION FOR LOCAL DOCKER MONGO DB
mongodb://admin:[email protected]:27017
DBT EXAMPLE CONFIGURATION
dbt init dbt_poc
Enter a number: 1
host (hostname for the instance): host.docker.internal
port [5432]: 5432
user (dev username): admin
pass (dev password): 12345678
dbname (default database that dbt will build objects in): spark
schema (default schema that dbt will build objects in): public
threads (1 or more) [1]: 1
DBT TESTING
cd  dbt_poc
dbt debug # test connection
dbt run # creates the tables
dbt docs generate # generates documentation
dbt docs serve --port 8081
🌀 dbt_poc DOCUMENTATION CLICK HERE 🌀
AIRFLOW TESTING
airflow scheduler
airflow webserver -p 8082
user : admin
pass: 12345678
💠 Airflow Interface CLICK HERE💠
Jenkins TESTING
service jenkins start
user : admin
pass: 12345678
💠 Jenkins Interface CLICK HERE💠
💠 Apache Nifi Interface CLICK HERE💠
# check user and password in the docker logs
docker run --name jorgecardona-nifi -p 8443:8443 -d -e NIFI_WEB_HTTPS_PORT='8443' jorgecardona/nifi:2.0.0-M4
KAFKA TESTING, RUN ZOOKEEPER, START BROKERS, LIST BROKERS, KAFKA SPARK STREAMING AND BATCH
🐳 Spark-Kafka Notebook GUIDE CLICK HERE 🐳
🐳 Testing Connections CLICK HERE 🐳
🐳 Testing Packages CLICK HERE 🐳
🐳 DBT Examples CLICK HERE 🐳
🐳 Execution Plan And Partitioning Example Postgresql CLICK HERE 🐳
🐳 How to Publish Packages in PyPi CLICK HERE 🐳
Tag summary
Content type
Image
Digest
sha256:ad313f3f0…
Size
3.6 GB
Last updated
over 2 years ago
docker pull jorgecardona/datascience