kevinrue/isee repository overview

iSEE - The interactive SummarizedExperiment Explorer
Software status




Overview
The iSEE package provides an interactive user interface for exploring data in objects derived from the SummarizedExperiment class.
Particular focus is given to single-cell data stored in the SingleCellExperiment derived class.
The user interface is implemented with RStudio's Shiny, with a multi-panel setup for ease of navigation.
This initiative was proposed at the European Bioconductor Meeting in Cambridge, 2017. Current contributors include:
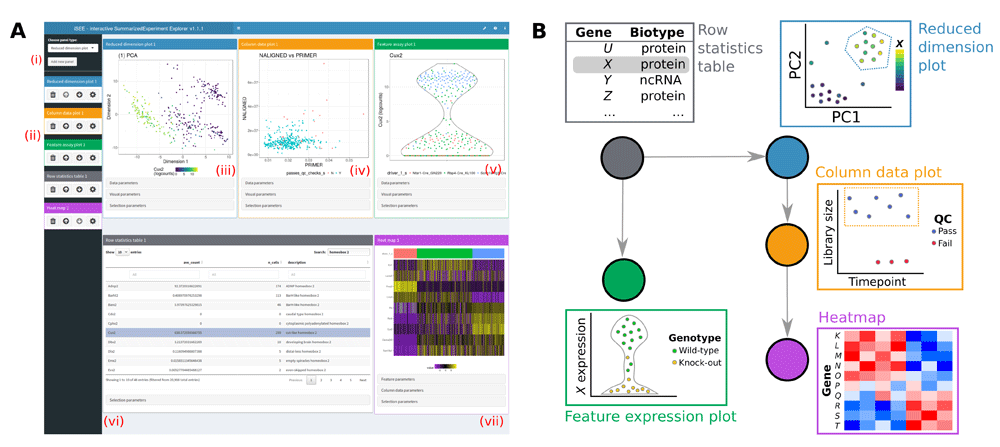
Functionalities
Click to expand the list of features available in iSEE applications.
General
:white_check_mark: Multiple interactive plot types with selectable points.
:white_check_mark: Interactive tables with selectable rows.
:white_check_mark: Coloring of samples and features by metadata or expression data.
:white_check_mark: Zooming to a plot subregion.
:white_check_mark: Transmission of point selections between panels to highlight, color, or restrict data points in the receiving panel(s).
:white_check_mark: Lasso point selection to define complex shapes.
Sample-level visualization
The iSEE user interface currently contains the following components where each data point represents a single biological sample:
:white_check_mark: Reduced dimension plot: Scatter plot of reduced dimensionality data.
:white_check_mark: Column data plot: Adaptive plot of any one or two sample metadata. A scatter, violin, or square design is dynamically applied according to the continuous or discrete nature of the metadata.
:white_check_mark: Feature assay plot: Adaptive plot of expression data across samples for any two features or one feature against one sample metadata.
:white_check_mark: Column statistics table: Table of sample metadata.
Feature-level visualization
The iSEE user interface currently contains the following components where each data point represents a genomic feature:
:white_check_mark: Row data plot: Adaptive plot of any two feature metadata. A scatter, violin, or square design is dynamically applied according to the continuous or discrete nature of the metadata.
:white_check_mark: Sample assay plot: Adaptive plot of expression data across features for any two samples or one sample against one feature metadata.
:white_check_mark: Row statistics table: Table of feature metadata.
Integrated visualization
The iSEE user interface contains the following components that integrate sample and feature information:
:white_check_mark: Heat map plot: Visualize multiple features across multiple samples annotated with sample metadata.
Custom panels
The iSEE user interface allows users to programmatically define their own plotting and table panels.
:white_check_mark: Custom data plot: Plotting panel that can be assigned any user-defined function returning a ggplot object.
:white_check_mark: Custom statistics table: Table panel that can be assigned any user-defined function returning a data.frame object.
Miscellaneous
:white_check_mark: The iSEE user interface continually tracks the code corresponding to all visible plotting panels. This code is rendered in a shinyAce text editor and can be copy-pasted into R scripts for customization and further use.
:white_check_mark: Speech recognition can be enabled to control the user interface using voice commands.
Want to try iSEE?
We set up instances of iSEE applications running on diverse types of datasets at those addresses:
- http://shiny.imbei.uni-mainz.de:3838/iSEE
- https://marionilab.cruk.cam.ac.uk/iSEE_allen
- https://marionilab.cruk.cam.ac.uk/iSEE_tcga
- https://marionilab.cruk.cam.ac.uk/iSEE_pbmc4k
- https://marionilab.cruk.cam.ac.uk/iSEE_cytof
Please keep in mind that those public instances are for trial purposes only;
yet they demonstrate how you or your system administrator can setup iSEE for analyzing or sharing your precomputed SummarizedExperiment/SingleCellExperiment object.
Extending iSEE
If you want to extend the functionality of iSEE, you can create custom panels which add new possibilities to interact with your data. You can find a gallery with working examples of how to do it here. Feel free to contact the developing team, should you need some clarifications on how iSEE works internally. Submit a pull request once the implementation is complete, if you want to have it added to the gallery.
Tag summary
Content type
Image
Digest
Size
2.3 GB
Last updated
over 8 years ago
docker pull kevinrue/isee