labbsr0x/bb-grafana repository overview
Big Brother Grafana
A repository to define valid Big-Brother Dashboards for Grafana
Example
At the example folder you'll find a simple example using the provided docker-compose.yml file.
By running docker-compose up --build you'll setup a metrics generator service that speaks the Big Brother protocol, a BB Promster and a custom Grafana that points by default to the example BB Promster.
After the example is up and running, you can import the dashboards that exist in the dashbaords folder and see for yourself how they behave.
Dashboards
At this moment we only have one dashboard, overview.json.
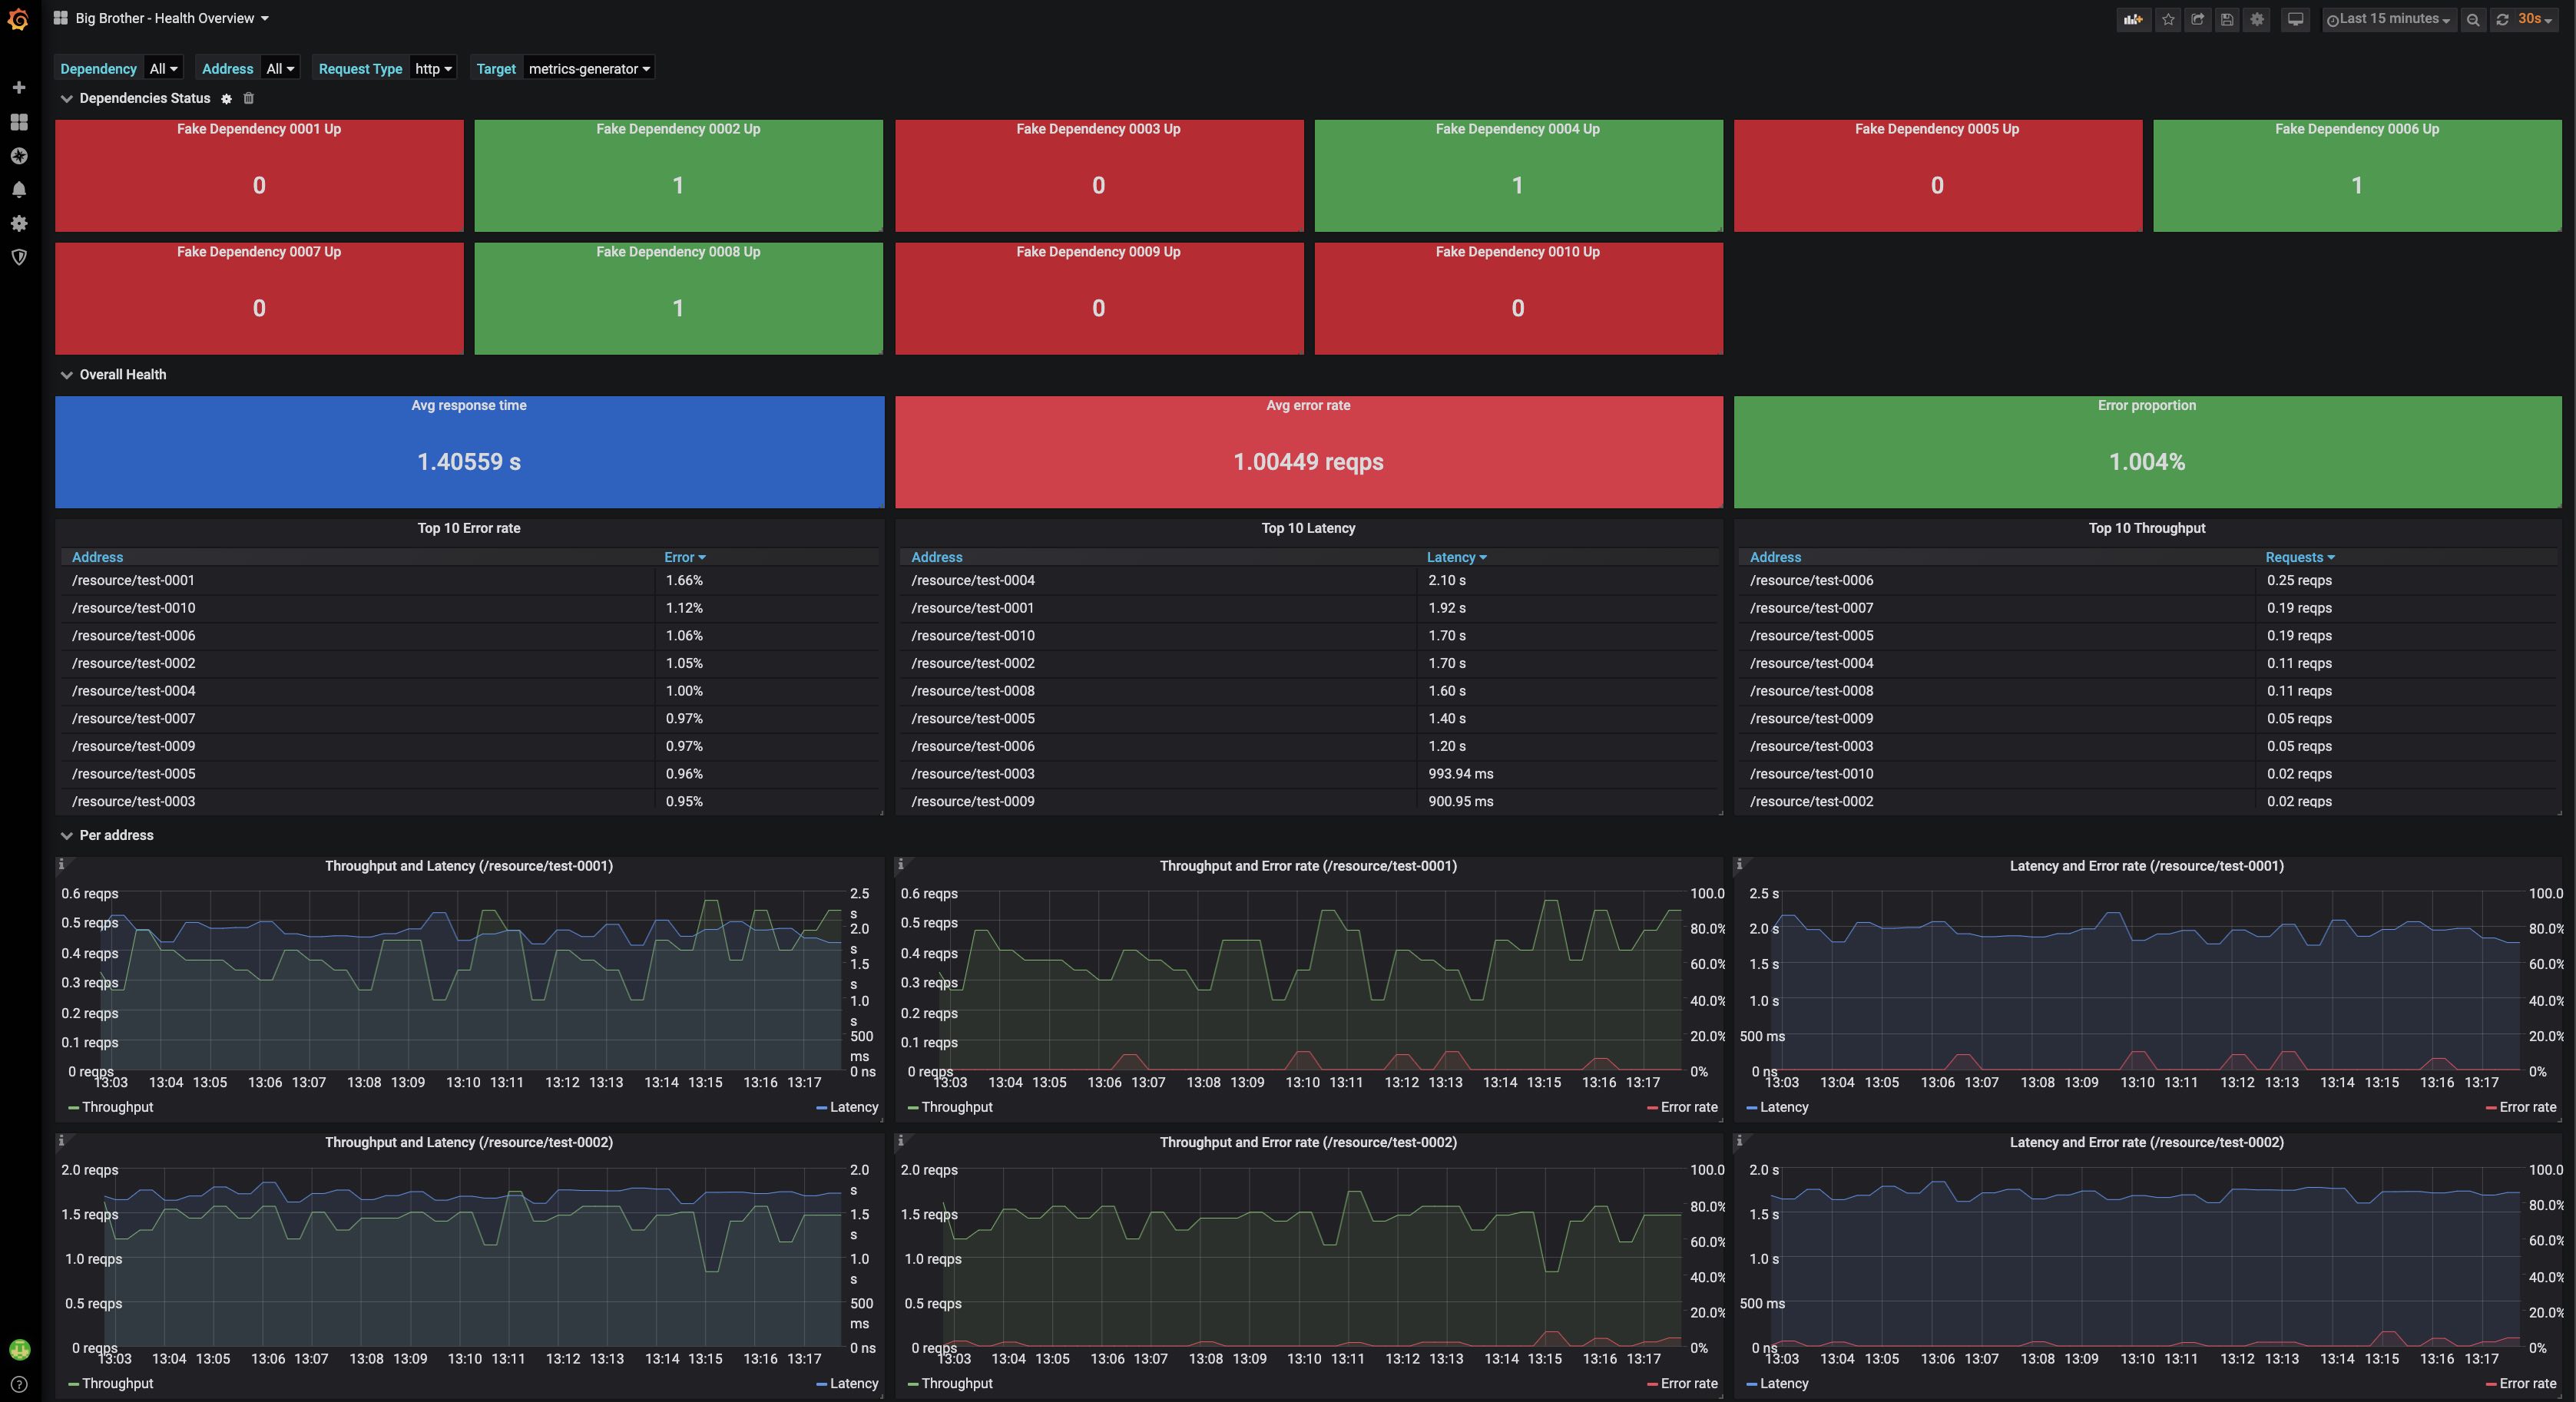
Health Overview
It exists at the Grafana.com dashboards marketplace with the ID 11544. Go check it out!
It provides 3 different rows:
Dependency Status: to check weather there is a failling dependency;Overall Health: an aggregated view of reponse time, error rate, error proportion and important Top 10s;Per address: a more granular view for each selected address;
Bellow is a preview:
Big Brother
This is part of a more large application called Big Brother.
Tag summary
Content type
Image
Digest
Size
132 MB
Last updated
about 6 years ago
docker pull labbsr0x/bb-grafana