leoverto/docker-network-graph
Visualize complex docker networks.
8.5K
leoverto/docker-network-graph repository overview
Docker Network Graph
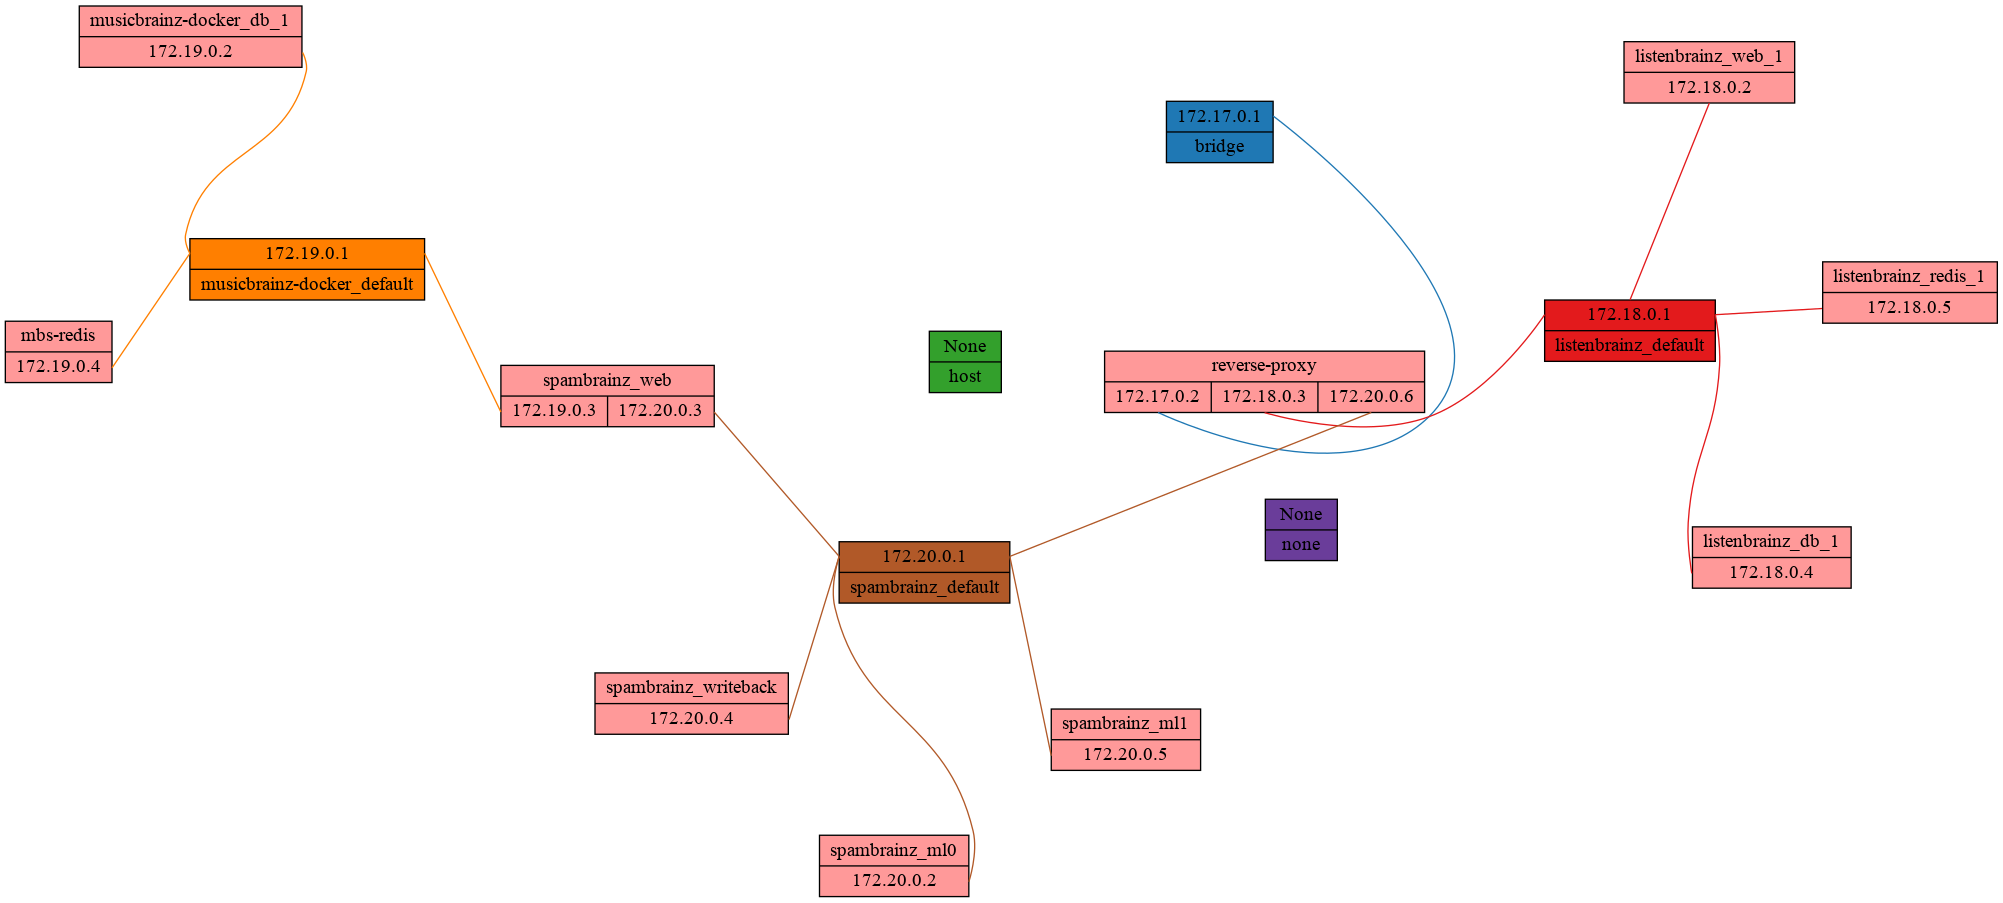
Visualize the relationship between Docker networks and containers as a neat graphviz graph.
Example
Usage
usage: docker-net-graph.py [-h] [-v] [-o OUT]

Visualize docker networks.

optional arguments:
  -h, --help         show this help message and exit
  -v, --verbose      Verbose output
  -o OUT, --out OUT  Write output to file
In most cases what you want to run are the following couple commands:
git clone https://github.com/LeoVerto/docker-network-graph.git
cd docker-network-graph
pipenv install
pipenv run python docker-net-graph.py -o output.svg
This will generate an .svg file containing the graph.
Running inside docker
If you want to generate a graph for a remote system you can also easily run this script inside a pre-built docker container:
docker run --rm -v /var/run/docker.sock:/var/run/docker.sock leoverto/docker-network-graph
This will just generate and output the graph in the DOT Language.
You can then paste that code into GraphvizOnline
to render it. The recommended rendering engine is fdp.
Alternatively, if you prefer to render locally, you can run
fdp -Tpng -o out.png on a system with graphviz installed,
paste the previous output there, press enter and finally CTRL+C to
generate the file.
For more advanced use cases you can append arguments to the docker run
command as if you were running it in a local shell.
Development
If you'd like to contribute to this project, there is a sample docker-compose file
using dummy containers in test.
You can deploy it using docker-compose -f test/docker-compose.yml up -d.
Tag summary
Content type
Image
Digest
Size
45.7 MB
Last updated
over 5 years ago
docker pull leoverto/docker-network-graph