meroje/phpfpm-exporter
PHP-FPM to Prometheus metrics exporter
838
meroje/phpfpm-exporter repository overview
PHP-FPM Exporter 


Prometheus exporter for php-fpm.
Exports metrics at 9127/metrics
This exporter also provides a way for embedding the output of arbitrary
PHP scripts into its metrics page, analogous to the node exporter's
textfile collector. Scripts that are specified with the
--phpfpm.script-collector-paths flag will be run through PHP-FPM. Any
metrics printed by the PHP script will be merged into the metrics
provided by this exported. An example use case includes printing metrics
for PHP's opcache.
Usage:
Run the exporter
./phpfpm_exporter --phpfpm.socket-paths /var/run/phpfpm.sock
Include additional metrics from a PHP script
E.g. export OPcache metrics (using contrib/php_opcache_exporter.php)
Bear in mind these metrics are global, all FPM pools share the same cache.
./phpfpm_exporter --phpfpm.socket-paths /var/run/phpfpm.sock \
--phpfpm.script-collector-paths /usr/local/bin/php_exporter/phpfpm_opcache_exporter.php
Run with Docker
SOCK="/run/php/php7.2-fpm.sock"; \
docker run -d -p 9127:9127 -v $SOCK:$SOCK  \
meroje/phpfpm-exporter \
--phpfpm.socket-paths=$SOCK
Help on flags
./phpfpm_exporter -h
usage: phpfpm_exporter [<flags>]

Flags:
  -h, --help     Show context-sensitive help (also try --help-long and --help-man).
      --web.listen-address=":9127"
                 Address to listen on for web interface and telemetry.
      --web.telemetry-path="/metrics"
                 Path under which to expose metrics.
      --phpfpm.socket-paths=PHPFPM.SOCKET-PATHS ...
                 Path(s) of the PHP-FPM sockets.
      --phpfpm.socket-directories=PHPFPM.SOCKET-DIRECTORIES ...
                 Path(s) of the directory where PHP-FPM sockets are located.
      --phpfpm.status-path="/status"
                 Path which has been configured in PHP-FPM to show status page.
      --version  Print version information.
      --phpfpm.script-collector-paths=PHPFPM.SCRIPT-COLLECTOR-PATHS ...
                 Paths of the PHP file whose output needs to be collected.
When using --phpfpm.socket-directories make sure to use dedicated directories for PHP-FPM sockets to avoid timeouts.
Metrics
| FPM column | Prometheus Metric | Description |
|---|---|---|
| accepted conn | php_fpm_accepted_connections_total | Number of request accepted by the pool. |
| listen queue | php_fpm_active_processes | Number of request in the queue of pending connections. |
| max listen queue | php_fpm_idle_processes | Maximum number of requests in the queue of pending connections since FPM has started. |
| listen queue len | php_fpm_listen_queue | The size of the socket queue of pending connections. |
| idle processes | php_fpm_listen_queue_length | Number of idle processes. |
| active processes | php_fpm_max_active_processes | Number of active processes. |
| total processes | php_fpm_max_children_reached | Number of total processes. |
| max active processes | php_fpm_max_listen_queue | Maximum number of active processes since FPM has started. |
| max children reached | php_fpm_slow_requests | Number of times, the process limit has been reached. |
| start time | php_fpm_start_time_seconds | Unix time when FPM has started or reloaded. |
| slow requests | php_fpm_total_processes | Enable php-fpm slow-log before you consider this. If this value is non-zero you may have slow php processes. |
Requirements
The FPM status page must be enabled in every pool you'd like to monitor by defining pm.status_path = /status.
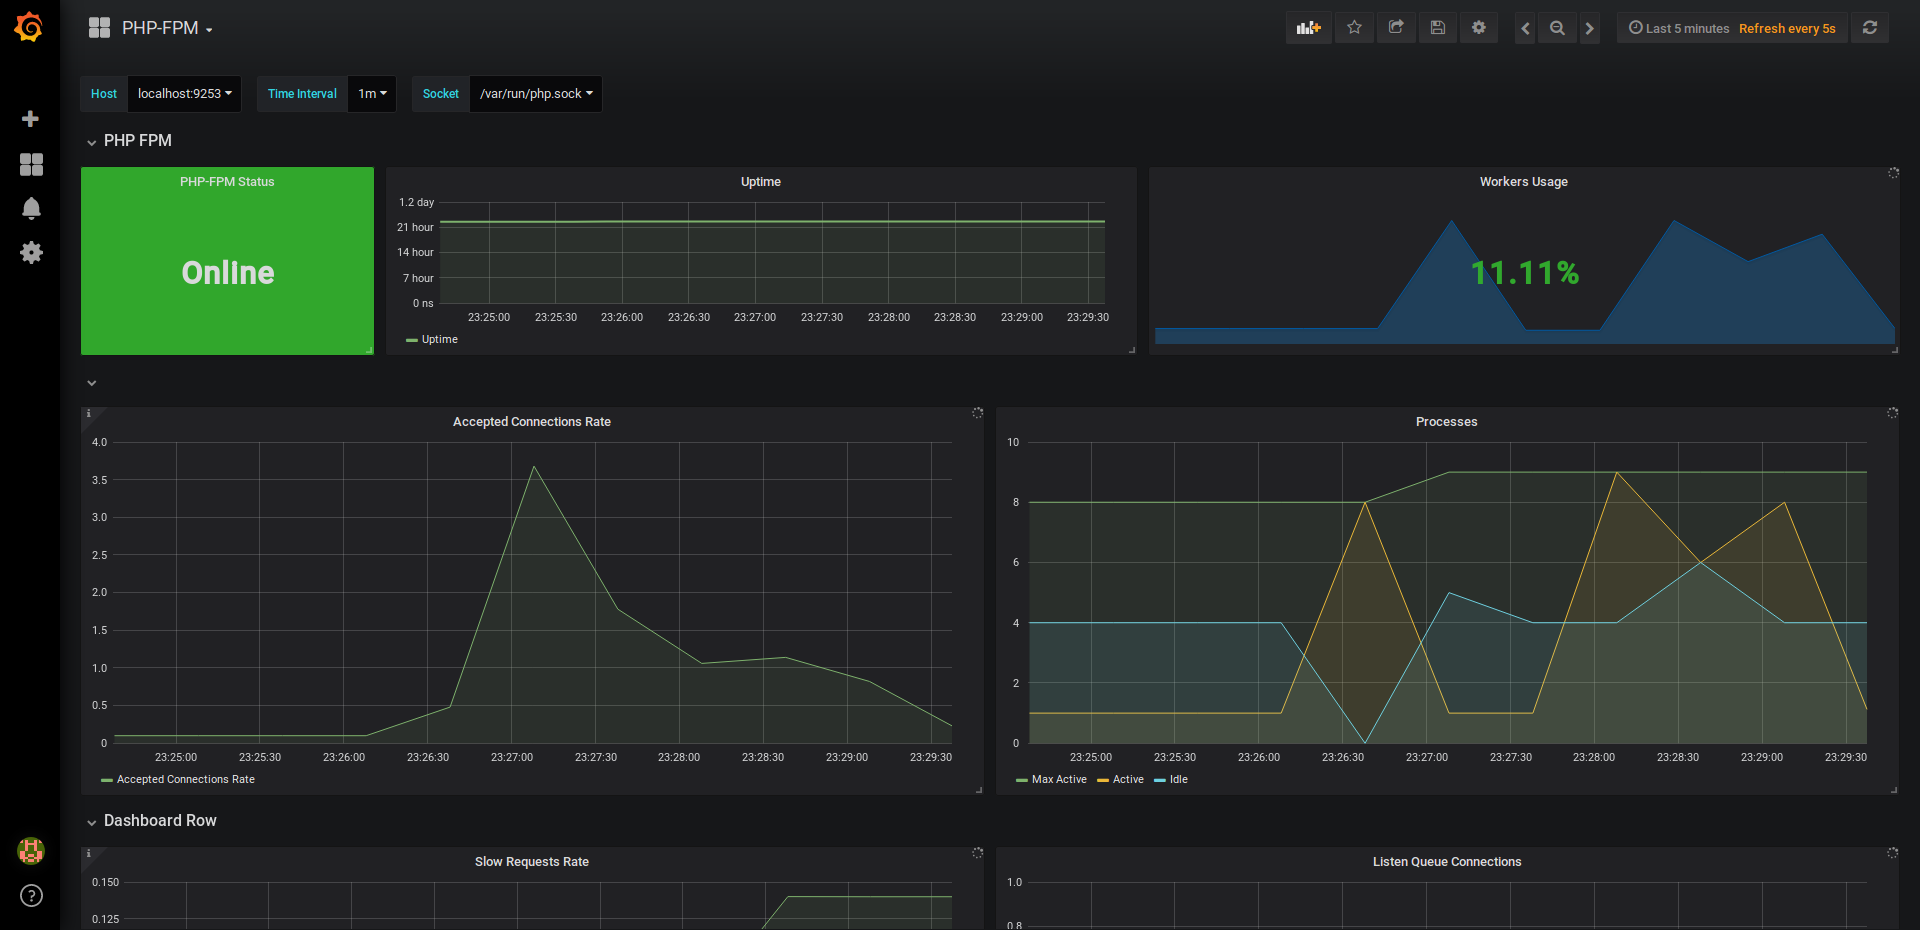
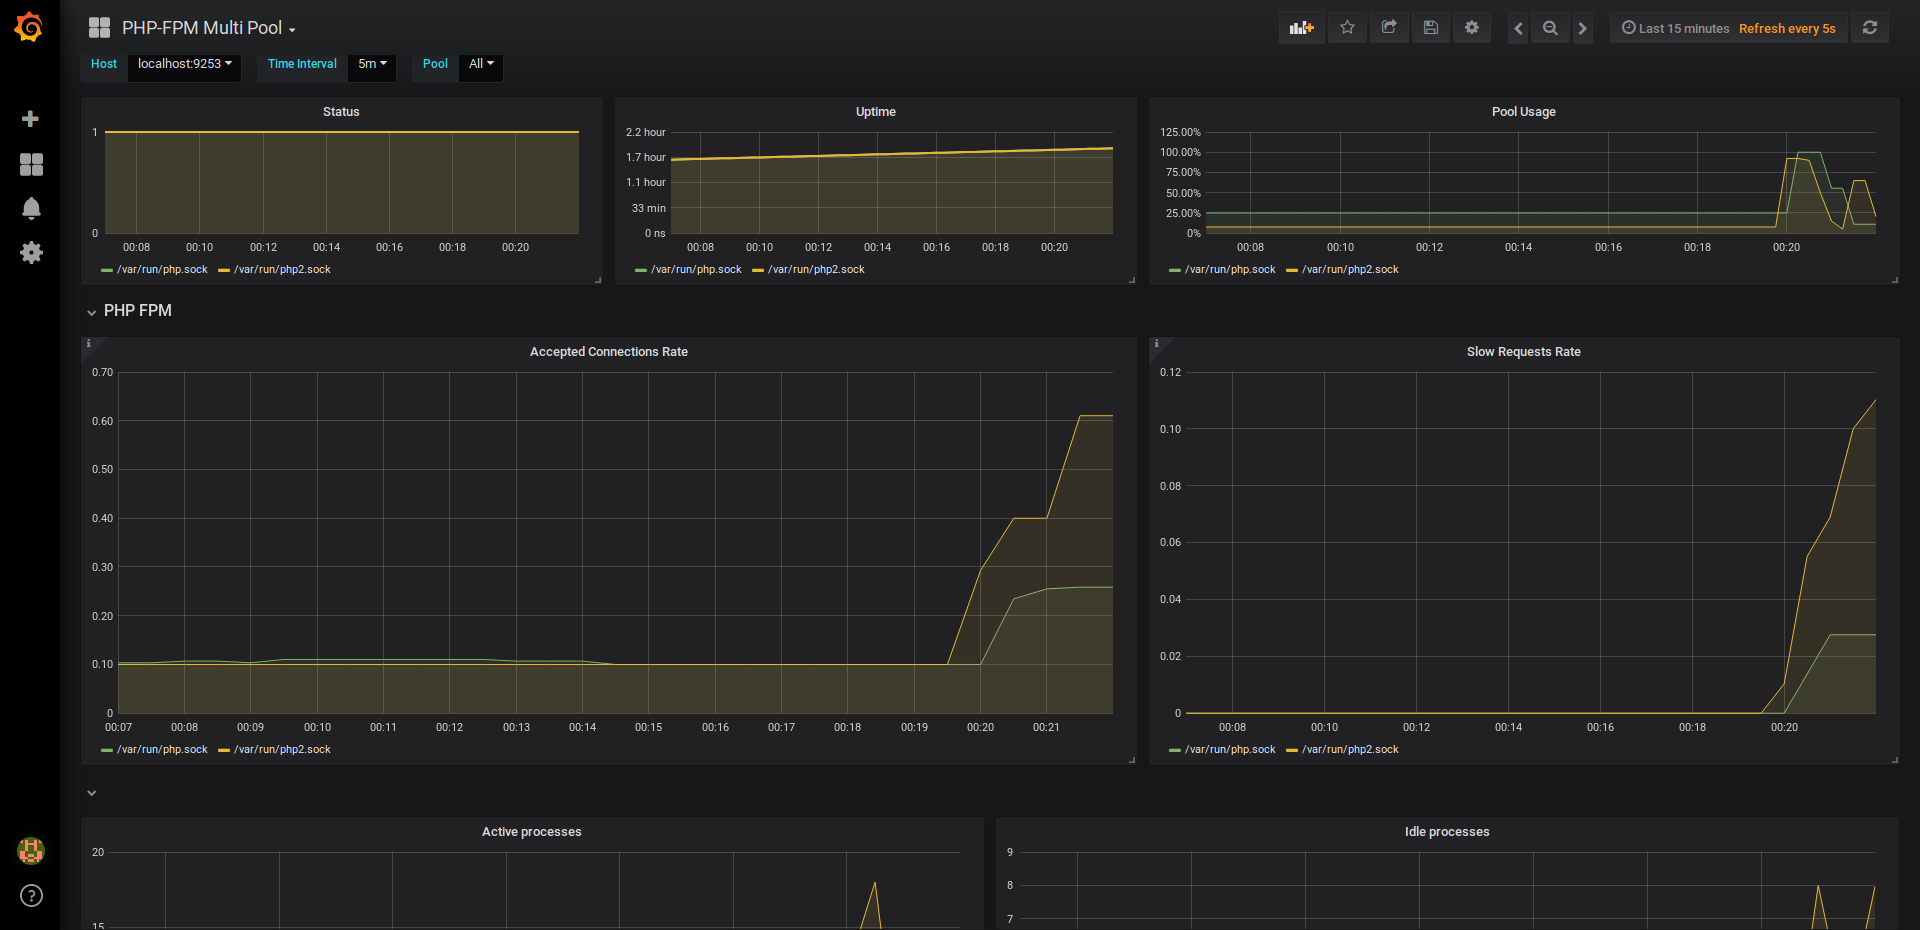
Grafana Dashboards
There's multiple grafana dashboards available for this exporter, find them at the urls below or in contrib/.
Basic: for analyzing a single fpm pool in detail.
Multi Pool: for analyzing a cluster of fpm pools.
Basic:
Multi Pool:
Tag summary
Content type
Image
Digest
Size
7.5 MB
Last updated
over 7 years ago
docker pull meroje/phpfpm-exporter