mlsh/graph-visualizer
Graph Visualizer is a browser-based tool for visualizing directed and undirected graphs (Emscripten)
882
mlsh/graph-visualizer repository overview
Graph Visualizer


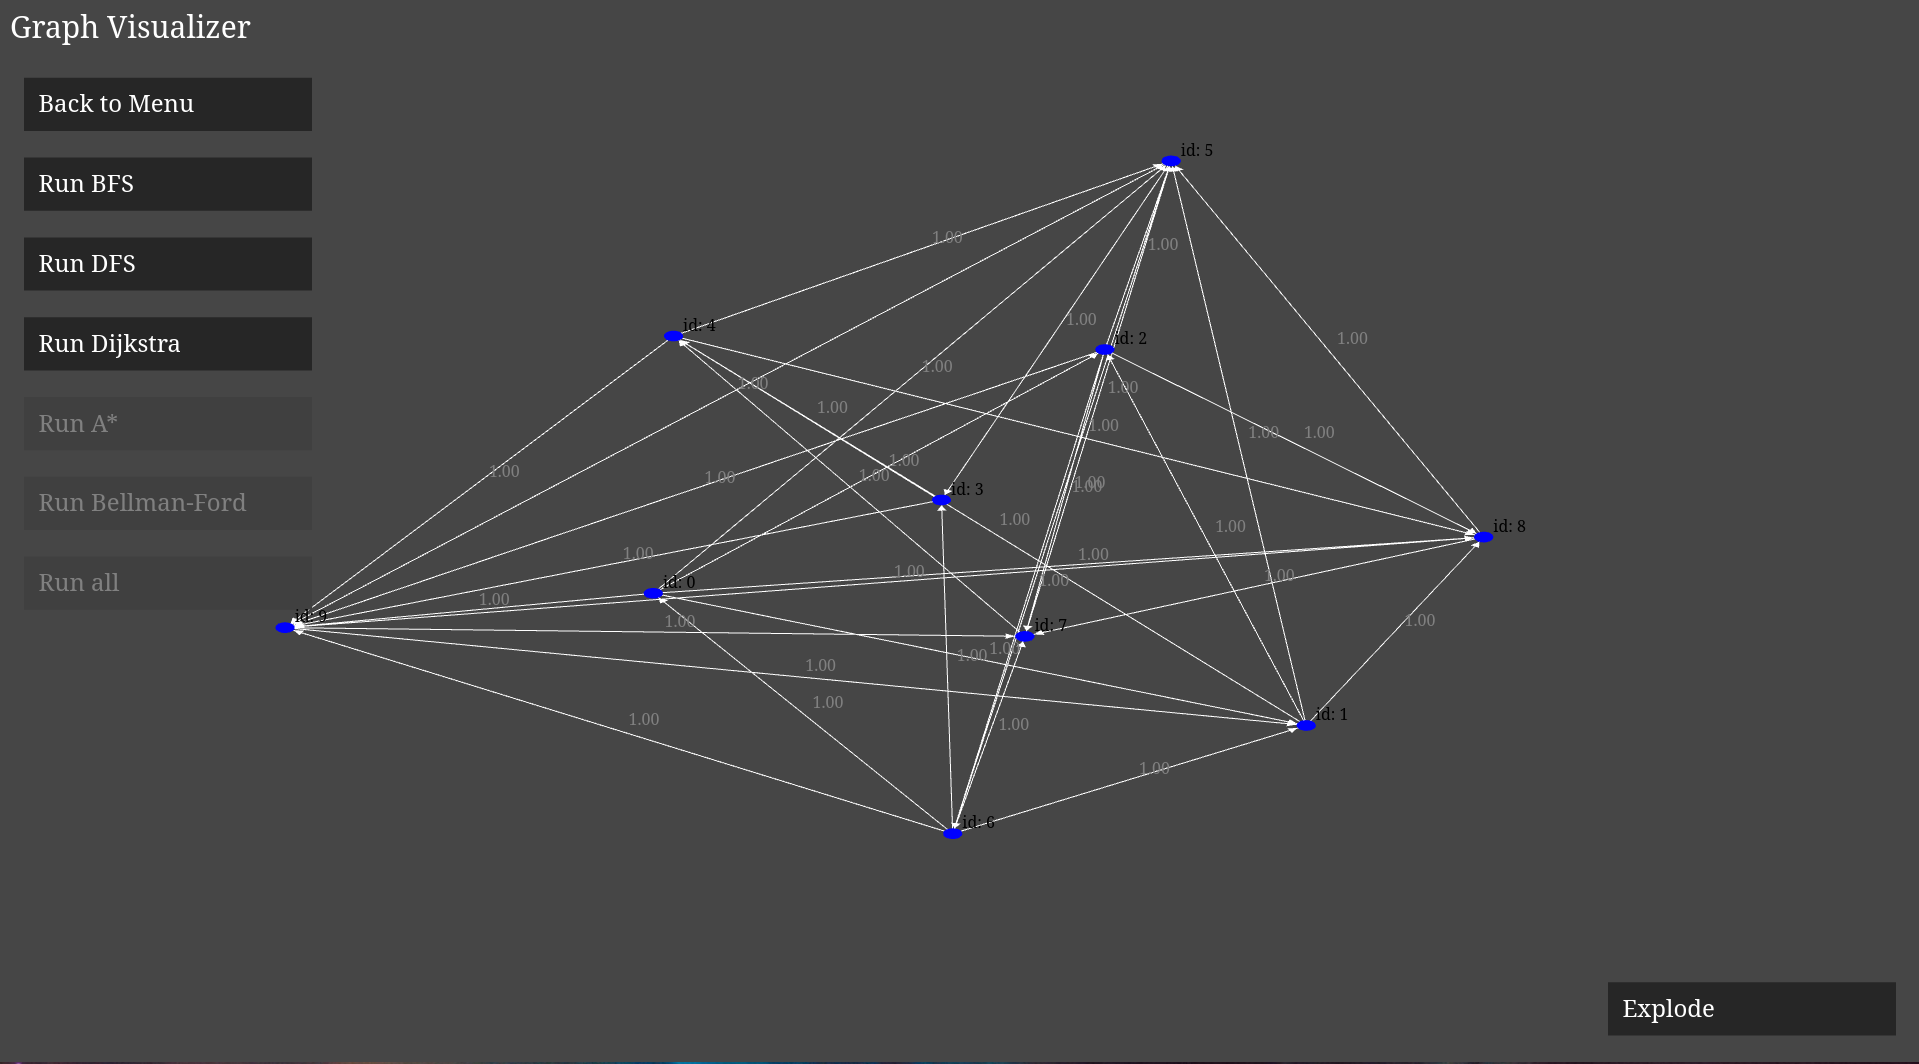
Graph Visualizer is a browser-based tool for visualizing directed and undirected graphs, featuring interactive traversal algorithms using WebGL and Emscripten. Try it out with the demo (note: might not scale well on mobile devices).
Table of Contents
- Features
- Prerequisites
- Build
- Graph Algorithms
- Project Structure
- Design Patterns
- Force-directed Graph Simulation
- Acknowledgements
- License
Features
- Create graphs in polygonal shapes or generate random graphs.
- Visualize graph traversal using BFS, DFS, and Dijkstra's algorithm.
- Step-by-step execution with one-second intervals.
- Interactive UI with WebGL rendering.
Prerequisites
Graph Visualizer is compiled by emcc, available from Emscripten. Build depends on ccache.
Build
Docker
Run docker compose up --build to create local instance of the project and access the demo at http://localhost:8081/demo/.
Manual build
Run the following to setup to get a working copy of this project:
git clone --recurse-submodules -j$(nproc) https://github.com/milosz275/graph-visualizer
cd graph-visualizer
make -j$(nproc)
Setup local server to test the app:
cp src/index.html build
cp assets/favicon.ico build
cd build
python3 -m http.server
Graph Algorithms
- BFS - Traverses the graph using a queue, exploring all neighbors of a node before moving to the next level.
- DFS - Traverses the graph using a stack, exploring as far as possible along each branch before backtracking.
- Dijkstra - Finds the shortest path from a source node to all other nodes using a priority queue, ensuring the lowest-cost path is always processed first. Recovers the best path by backtracking from the target node to the source.
- A* - An optimized shortest-path algorithm that combines Dijkstra’s approach with a heuristic function to estimate the remaining cost, guiding the search more efficiently toward the target.
- Bellman-Ford - Computes the shortest paths from a source node to all other nodes, allowing for negative-weight edges. Iteratively relaxes edges, ensuring that no shorter path exists. Can detect negative-weight cycles.
Project Structure
The project uses the web-ui frontend framework for rendering. It follows the Model-View-Controller (MVC) architecture to separate concerns effectively.
- Model - Abstract elements of the Graph Visualizer such as graph nodes, their physical properties along with graph algorithms, state of individual nodes and representation.
- View - Graphical aspect of both the program's state, UI and the graph itself.
- Controller - Interaction with the canvas with mouse and canvas translation to model component, and canvas resizing (no keyboard integration at this point).
Design Patterns
Graph Visualizer is a highly abstracted project that leverages multiple design patterns, with MVC as the primary architectural pattern.
Creational Patterns
- Singleton – Ensures only one instance of the Graph App exists.
- Abstract Factory – Used for UI elements such as labels and buttons, allowing flexible UI customization.
Structural Patterns
- Facade – Simplifies interactions with the web framework and user input.
- Proxy – Handles input callbacks efficiently.
- Composite – Groups nodes into graph structures.
Behavioral Patterns
- State Pattern – Manages different states of the program and executes appropriate behavior.
- Visitor Pattern – Allows traversal algorithms to operate on graph nodes without modifying their structure.
Force-directed Graph Simulation
Graph Visualizer includes a force-directed graph simulation that models realistic physical interactions between nodes. The simulation applies several forces to create a natural graph layout:
- Repulsion Force – Nodes repel each other to avoid overlap, using a repulsion constant
k_r. - Attraction Force – Connected nodes attract each other like springs, controlled by an attraction constant
k_aand a rest length parameter. - Gravity Force – Nodes experience a gravitational pull toward a central point, determined by a gravity constant
k_g. - Velocity and Damping – The simulation updates node positions and velocities over time
time_step, with damping to smooth movements. - Explosion Force – An optional burst force can be applied to disperse nodes outward, simulating an explosion effect.
These physics-based forces create an intuitive and interactive experience when exploring graph structures.
Acknowledgements
License
This project is licensed under the MIT License - see the LICENSE file for details.
Tag summary
Content type
Image
Digest
sha256:a9214f186…
Size
843.1 MB
Last updated
over 1 year ago
docker pull mlsh/graph-visualizer