nkumarcc/redlemur
An intuitive web application that allows data scientists to visualize different types of data.
916
nkumarcc/redlemur repository overview
Red Lemur's Docker images uses the redlemur Python package in an intuitive web application that allows data scientists to visualize different datasets. Additionally, neuroscientists with multimodal datasets can specifically focus on identifying patterns relevant to the known biomarker, the p-factor.
Lemur is a library to assist in the aggregate and one-to-one visualization of any set of data points. This tool was designed to assist in the visualization of multi-modal neuroscience/psychology datasets, but it can be used for any set of objects and similarity / dissimilarity function acting on pairs of such objects.
Walkthrough with Demo Files
1. Download the Demo Files
- Go to https://drive.google.com/open?id=163zn9TwyKqs6yPtJ9DsilGibk8S1E4ji
- Download the file using the download button in the upper right hand side of the page.
- Go to https://drive.google.com/open?id=1r_EAtJUK7NA-tbzCdi5_8rxIHHIEI5nn
- Download the file using the downloadbutton in the upper right hand side of the page.
2. Pull the Docker Image
- Pull the docker image with
docker pull nkumarcc/redlemur
3. Launch the Docker Image
- Launch the docker image with
docker run -p 5000:5000 nkumarcc/redlemur - Congrats! Your image is now live on your machine at http://0.0.0.0:5000/
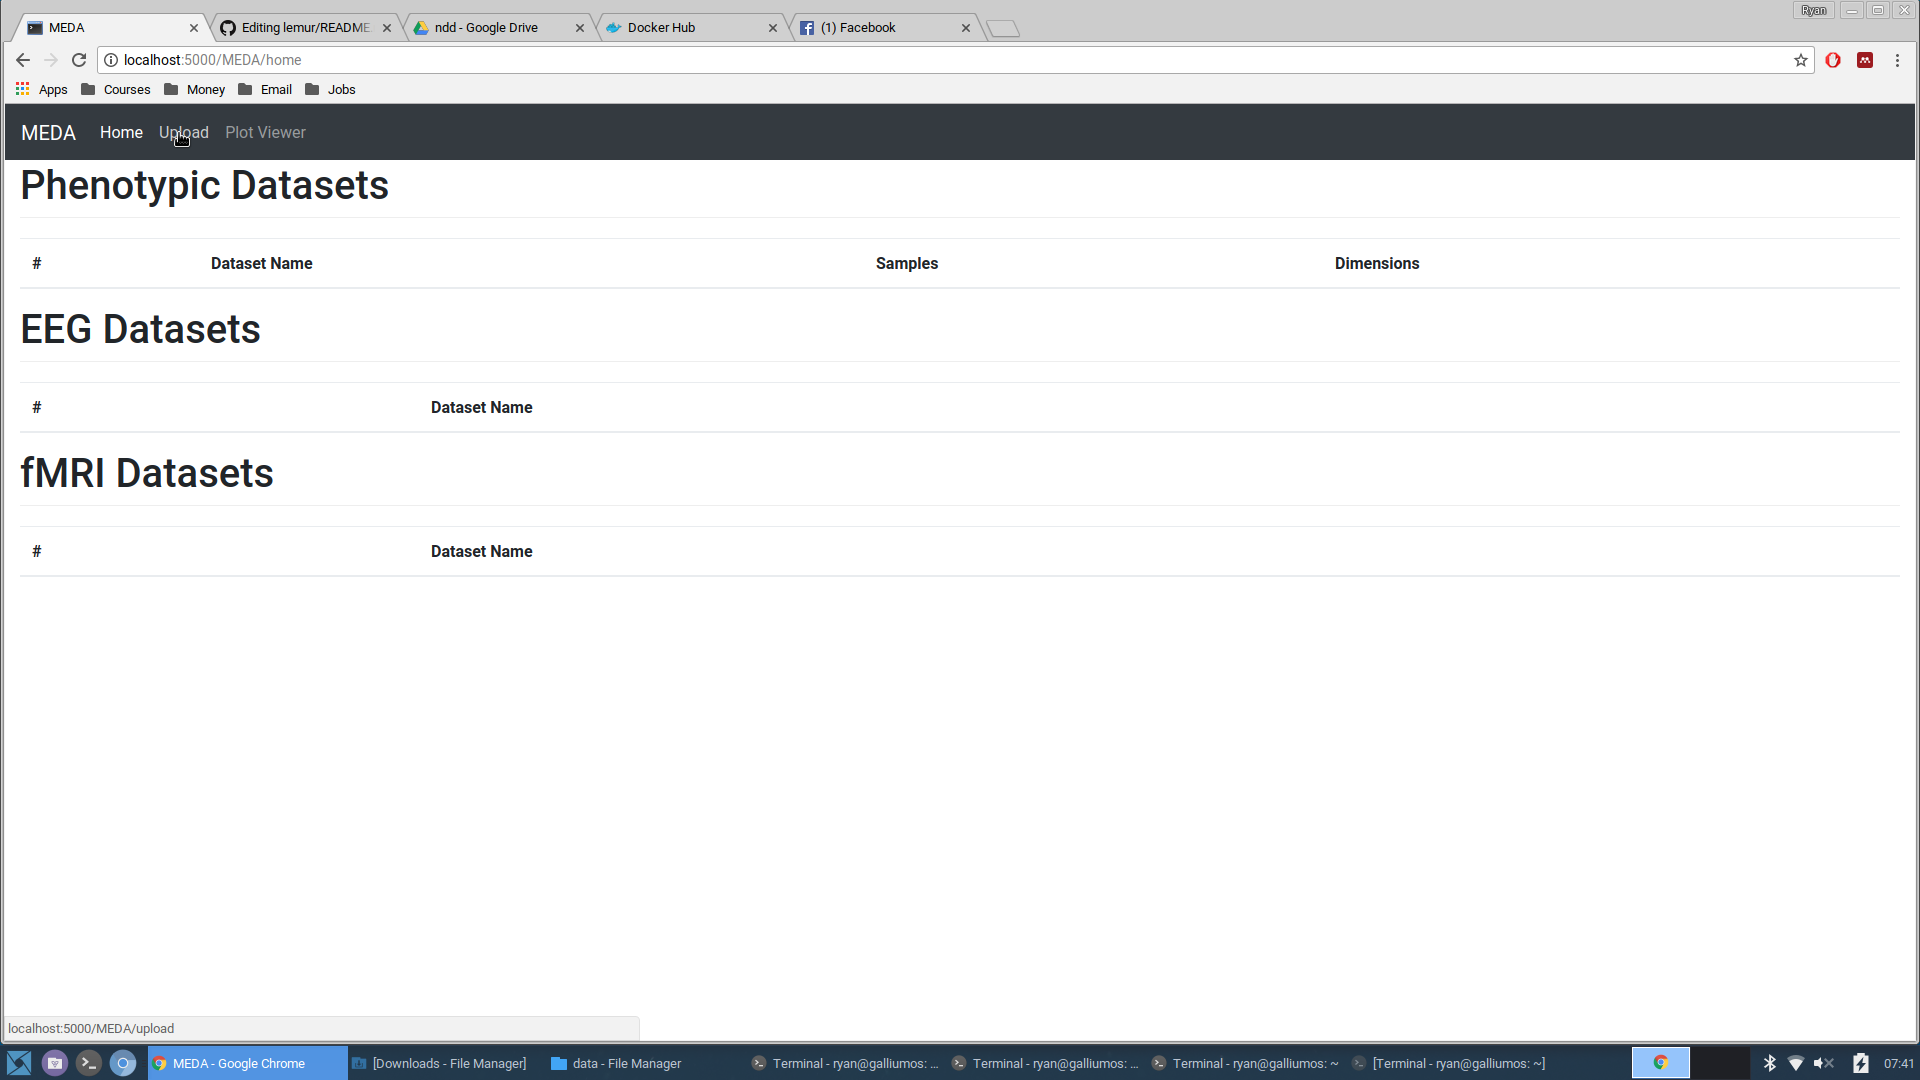
4. Launch a New Image Processing Job
-
Go to the 'Upload' tab
-
Click on the button to upload a phenotypic .csv file
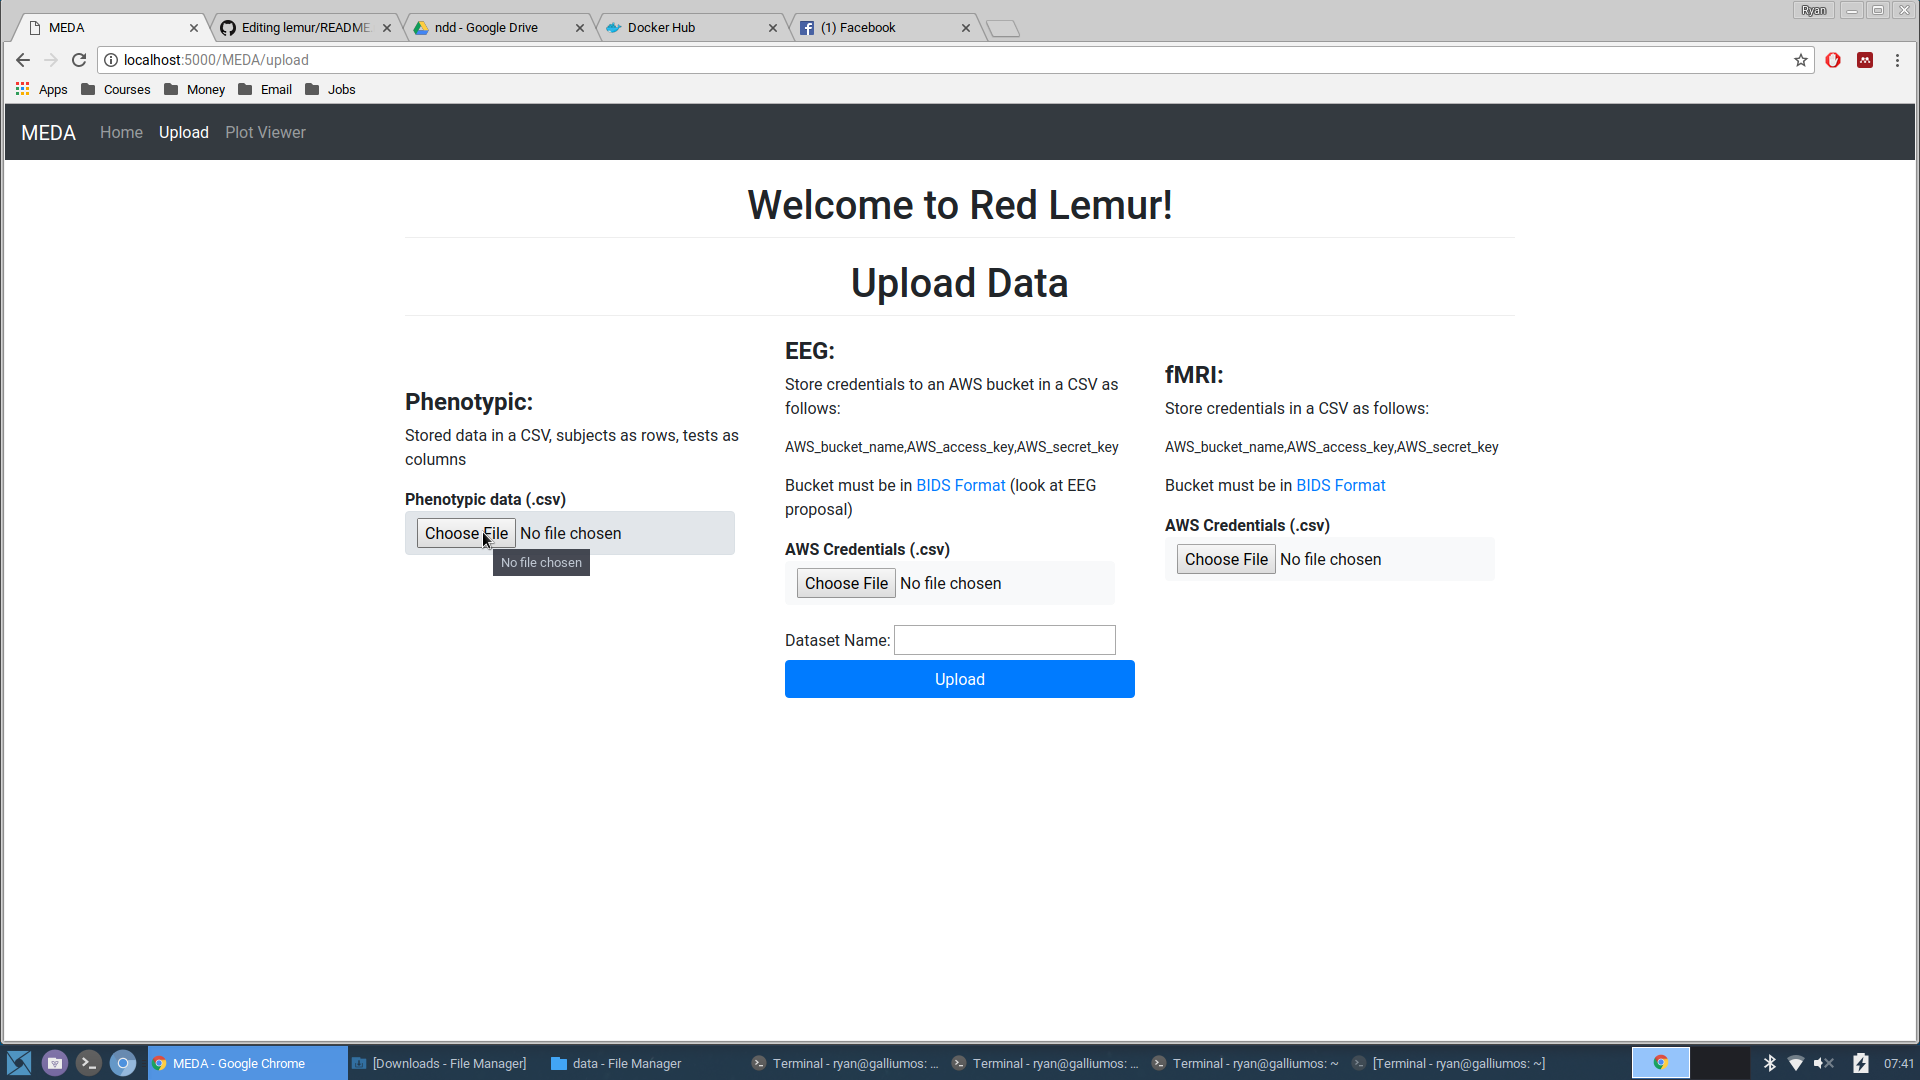
-
Navigate to the iris.csv file and choose it
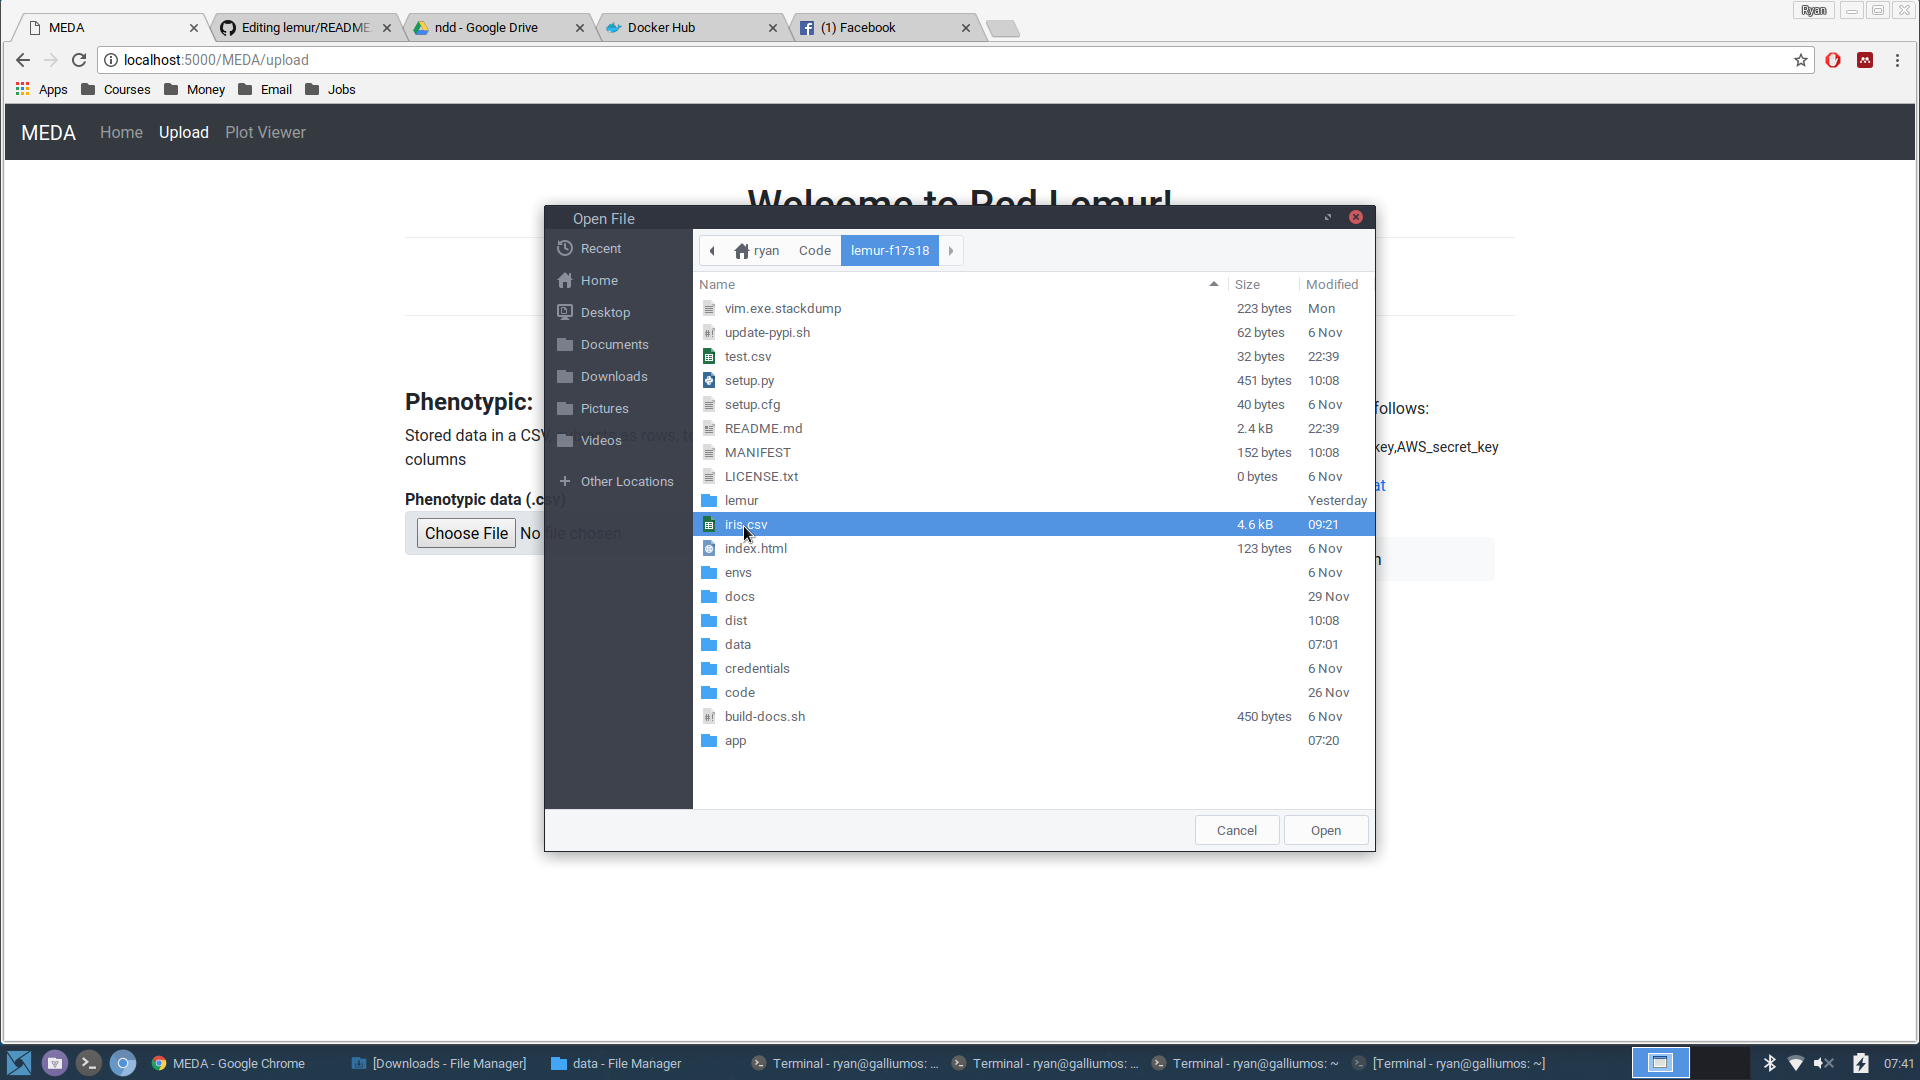
-
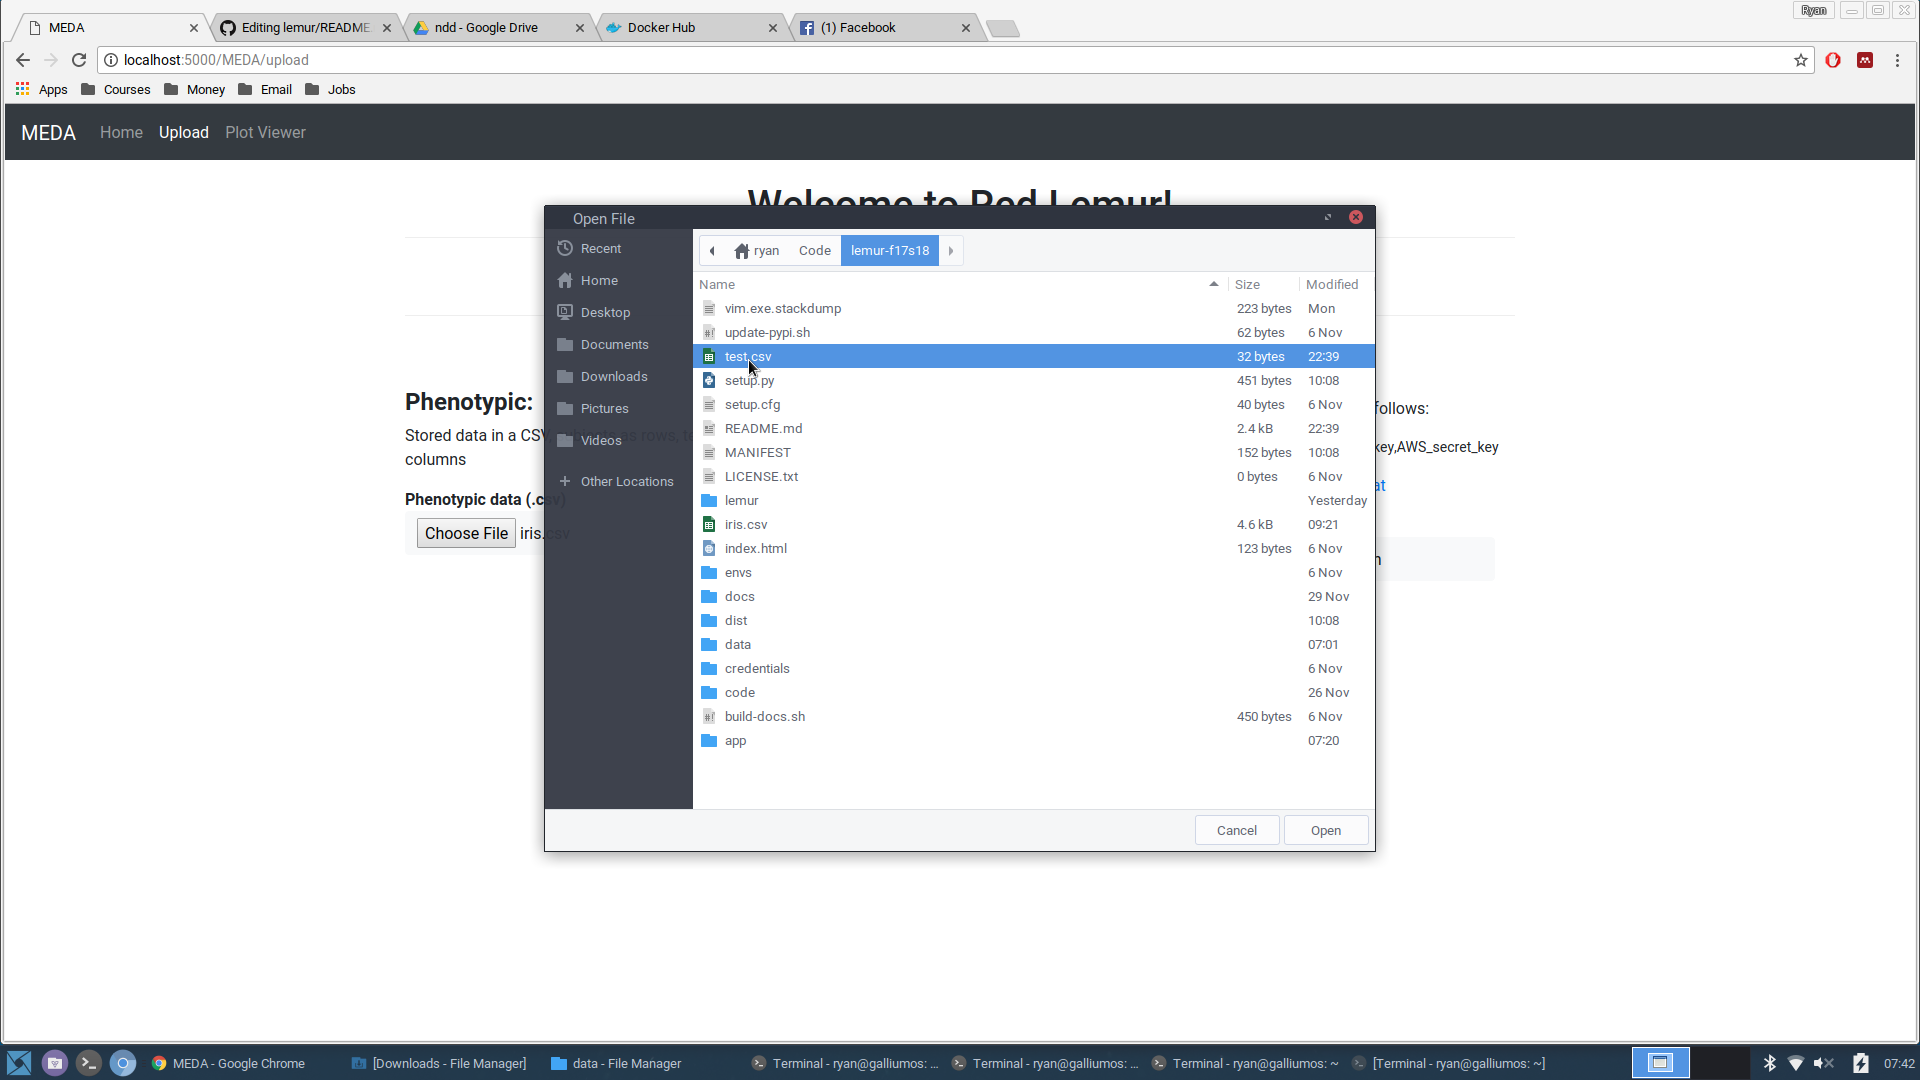
Click on the button to upload a EEG credentials .csv file
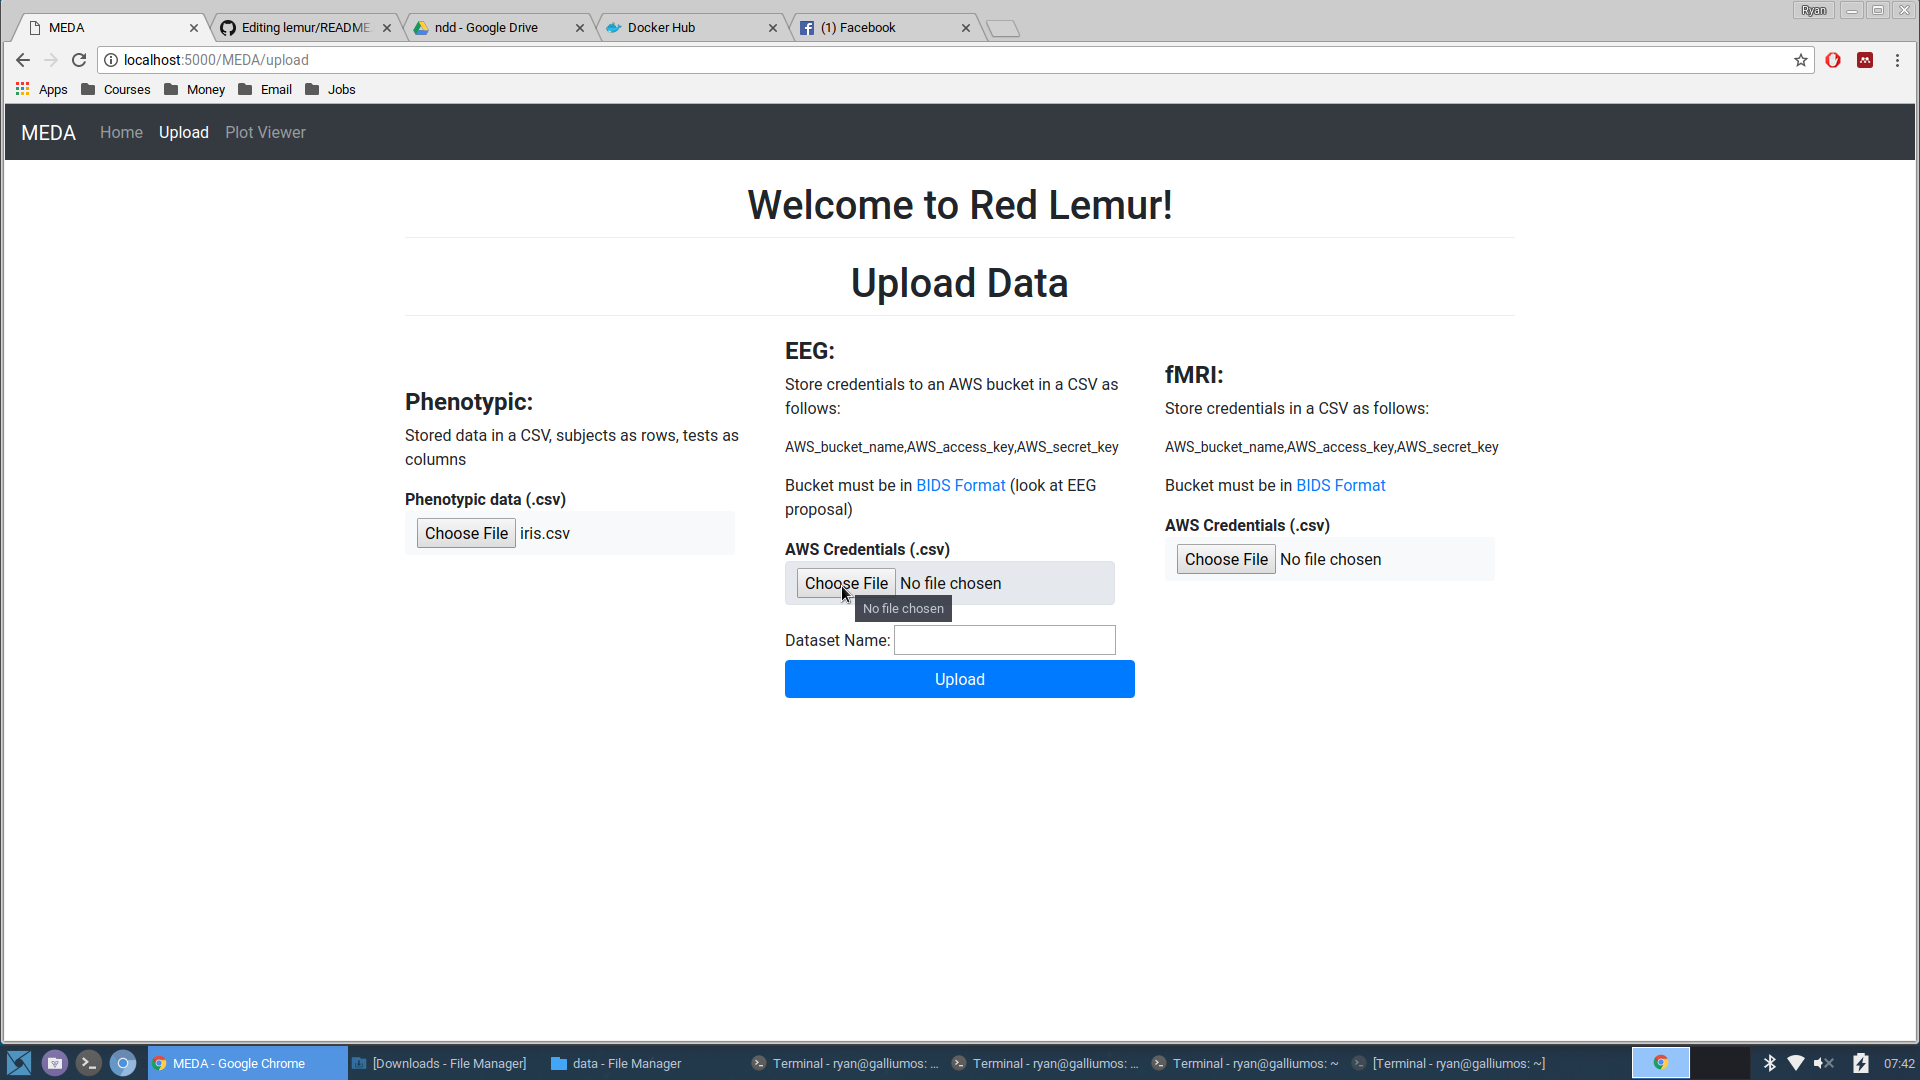
-
Navigate to the test.csv file and choose it
-
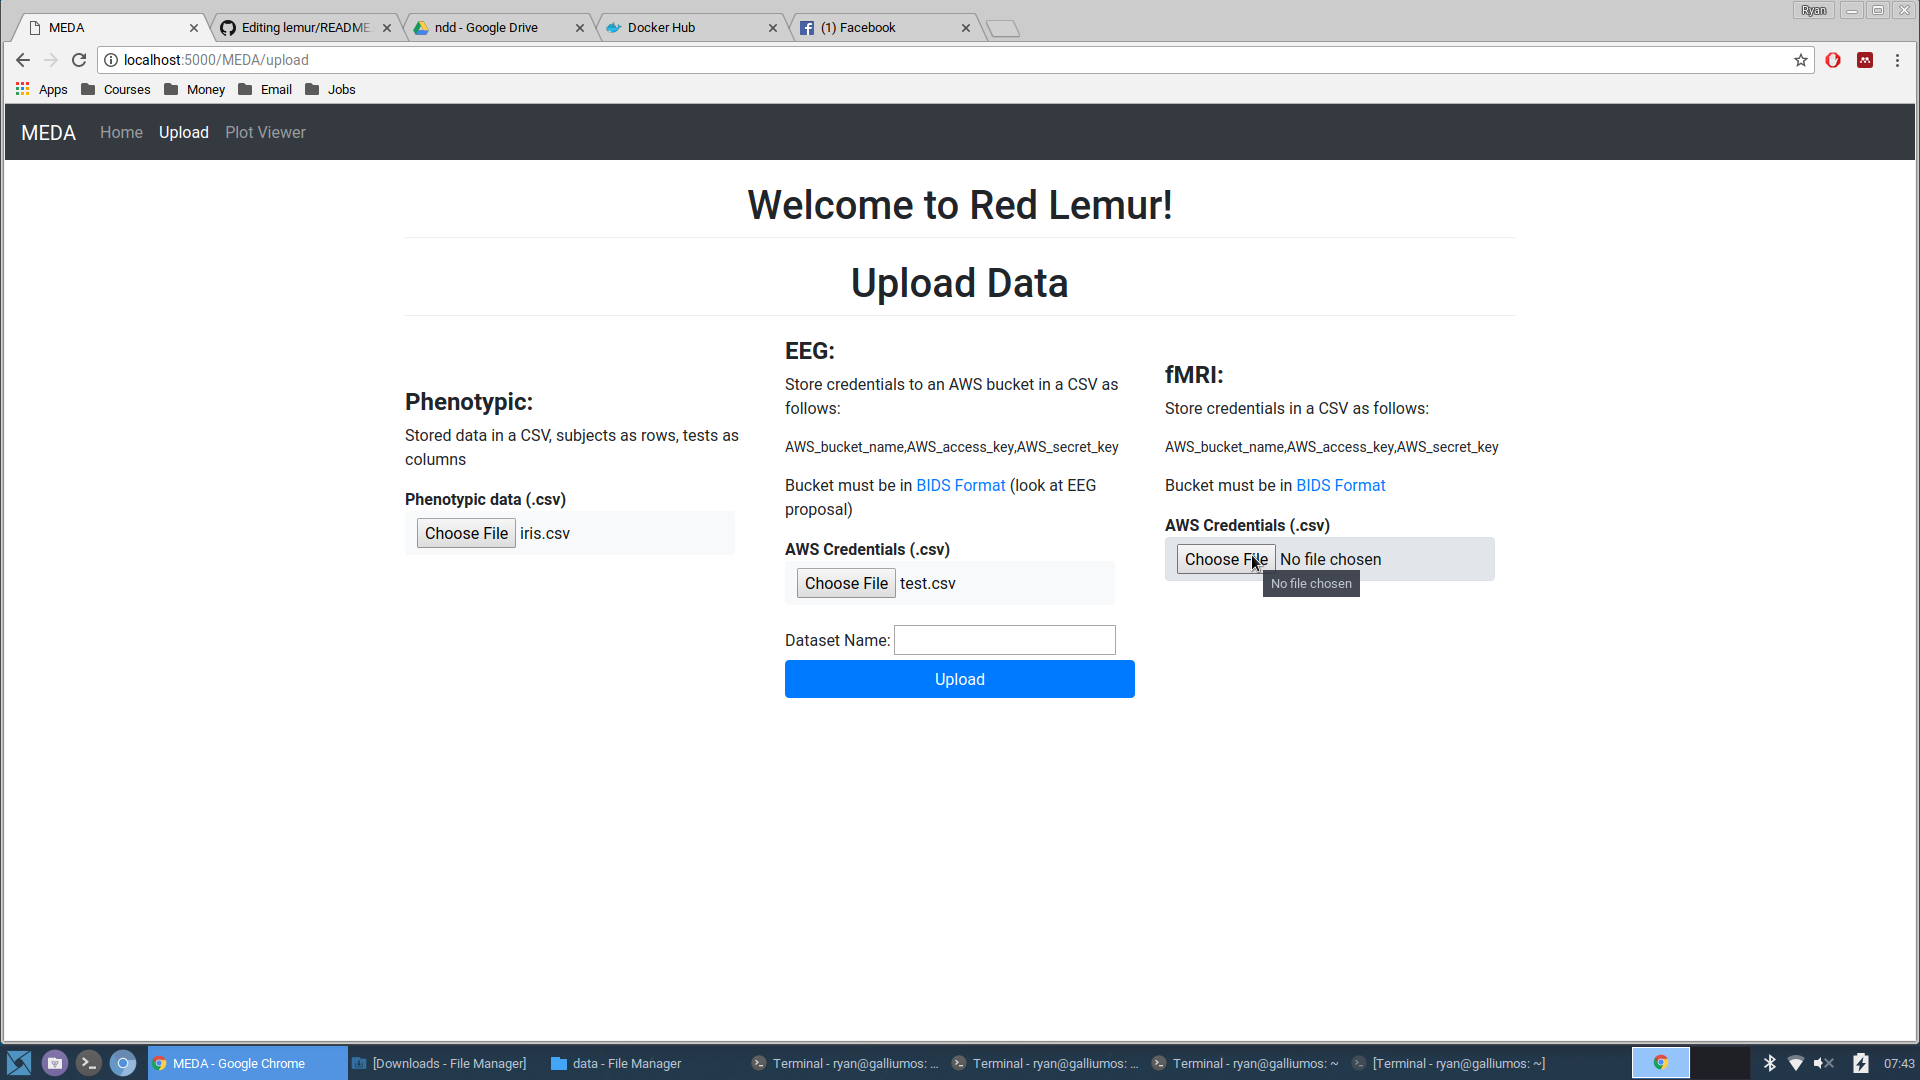
Click on the button to upload a fMRI credentials .csv file
-
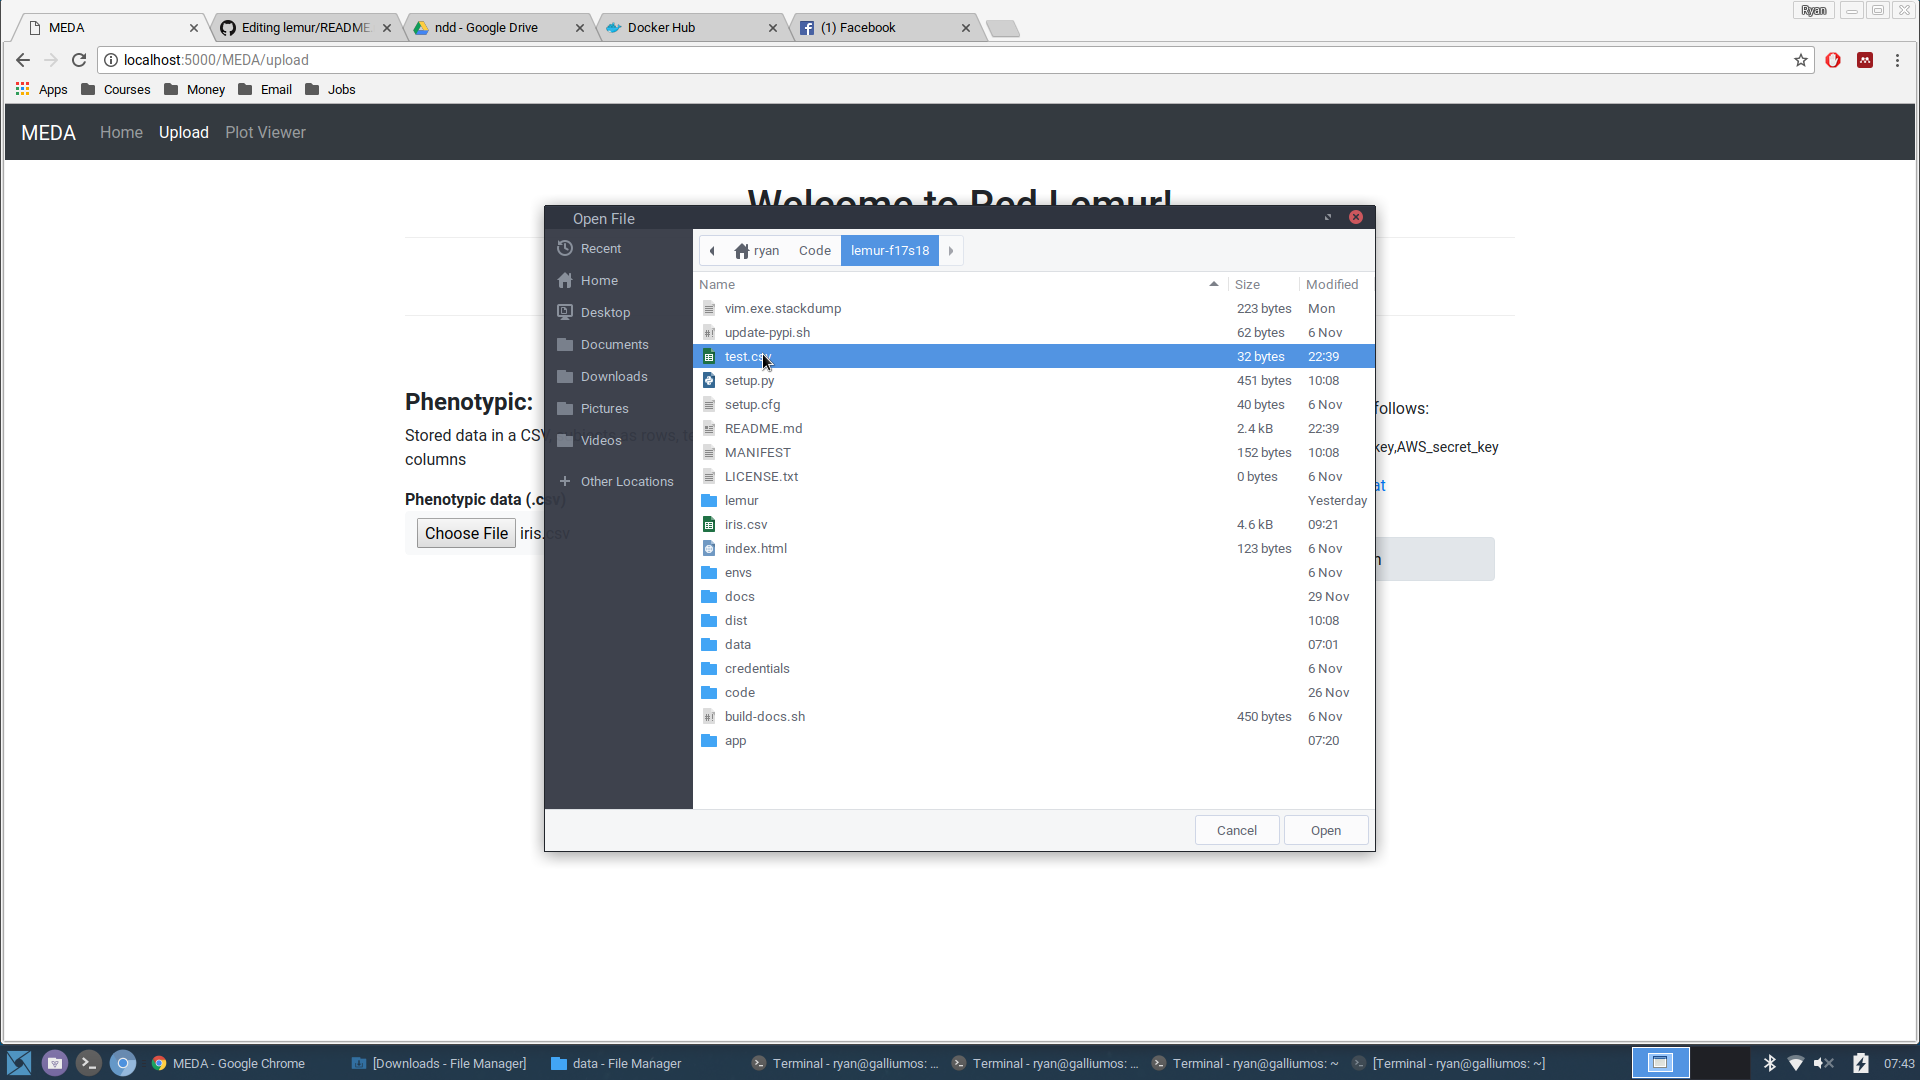
Navigate to the test.csv file and choose it
-
Name your new dataset
test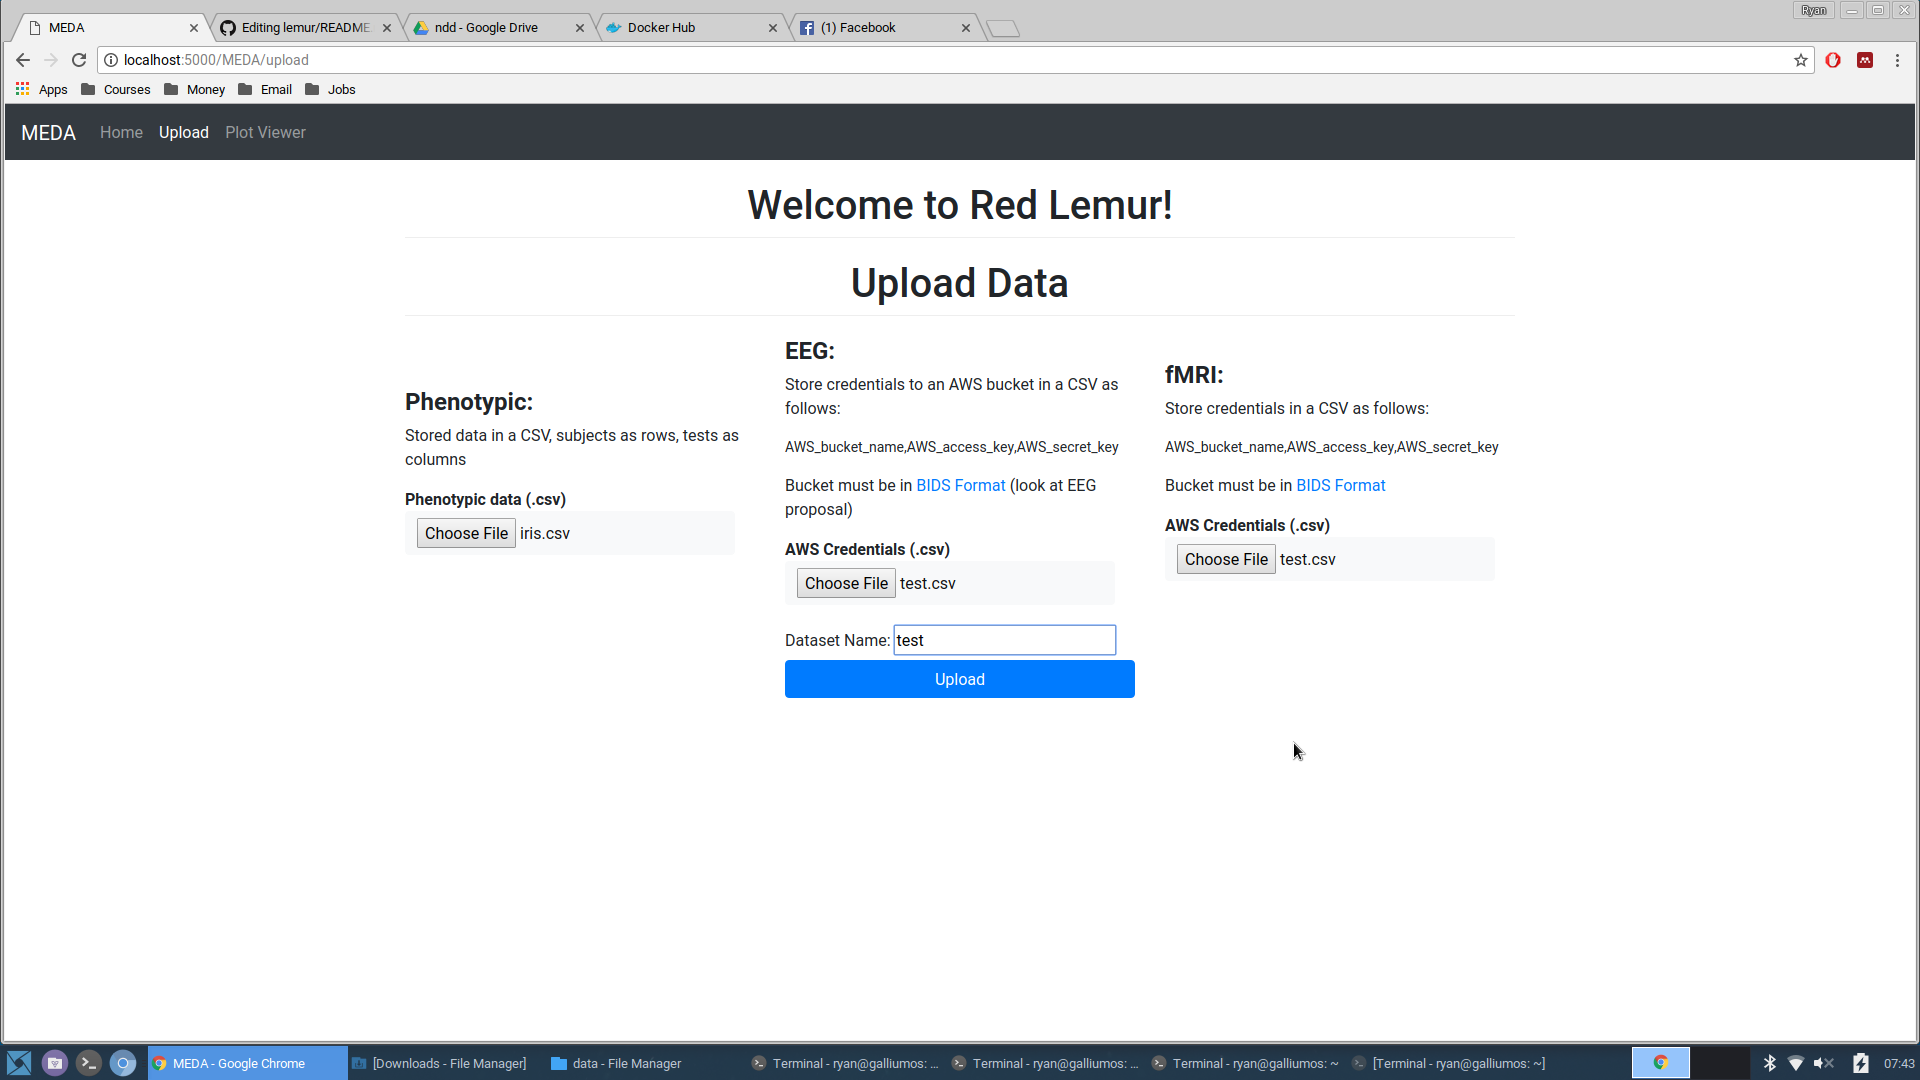
-
Click the upload button, and wait without touching anything. You can check the progress of the job by opening the terminal from which the docker image was launched from.
-
You will automatically be redirected to the EEG plots page when this process is complete.
5. Navigating to Different Modalities
-
To get to another modality other than EEG (remember, this is where you were automatically directed), click the home button in the upper menu bar.
-
You will see three sections for Phenotypic, EEG, and fMRI data respectively. Clicking the blue link with the name of your dataset will redirect you to the page with the plots for that modality.
Tag summary
Content type
Image
Digest
Size
543.9 MB
Last updated
over 8 years ago
docker pull nkumarcc/redlemur