pgsty/pg_exporter
PostgreSQL/Pgbouncer metrics exporter for Prometheus
10K+
pgsty/pg_exporter repository overview
PG EXPORTER




Features
- Highly Customizable: Define almost all metrics through declarative YAML configs
- Full Coverage: Monitor both PostgreSQL (10-18+) and pgBouncer (1.8-1.24+) in single exporter
- Fine-grained Control: Configure timeout, caching, skip conditions, and fatality per collector
- Dynamic Planning: Define multiple query branches based on different conditions
- Self-monitoring: Rich metrics about pg_exporter itself for complete observability
- Production-Ready: Battle-tested in real-world environments across 12K+ cores for 6+ years
- Auto-discovery: Automatically discover and monitor multiple databases within an instance
- Health Check APIs: Comprehensive HTTP endpoints for service health and traffic routing
- Extension Support:
timescaledb,citus,pg_stat_statements,pg_wait_sampling,...
Quick Start
RPM / DEB / Tarball available in the GitHub release page, and Pigsty's YUM / APT repo.
To run this exporter, you need to pass the postgres/pgbouncer URL via env or arg:
PG_EXPORTER_URL='postgres://user:pass@host:port/postgres' pg_exporter
curl http://localhost:9630/metrics   # access metrics
There are 4 built-in metrics pg_up, pg_version, pg_in_recovery, pg_exporter_build_info.
All other metrics are defined in the pg_exporter.yml config file.
There are two monitoring dashboards in the monitor/ directory.
You can use Pigsty to monitor existing PostgreSQL cluster or RDS, it will setup pg_exporter for you.
Advanced PostgreSQL & pgBouncer metrics exporter for Prometheus
PG Exporter brings ultimate monitoring experience to your PostgreSQL with declarative config, dynamic planning, and customizable collectors. It provides 600+ metrics and ~3K time series per instance, covers everything you'll need for PostgreSQL observability.
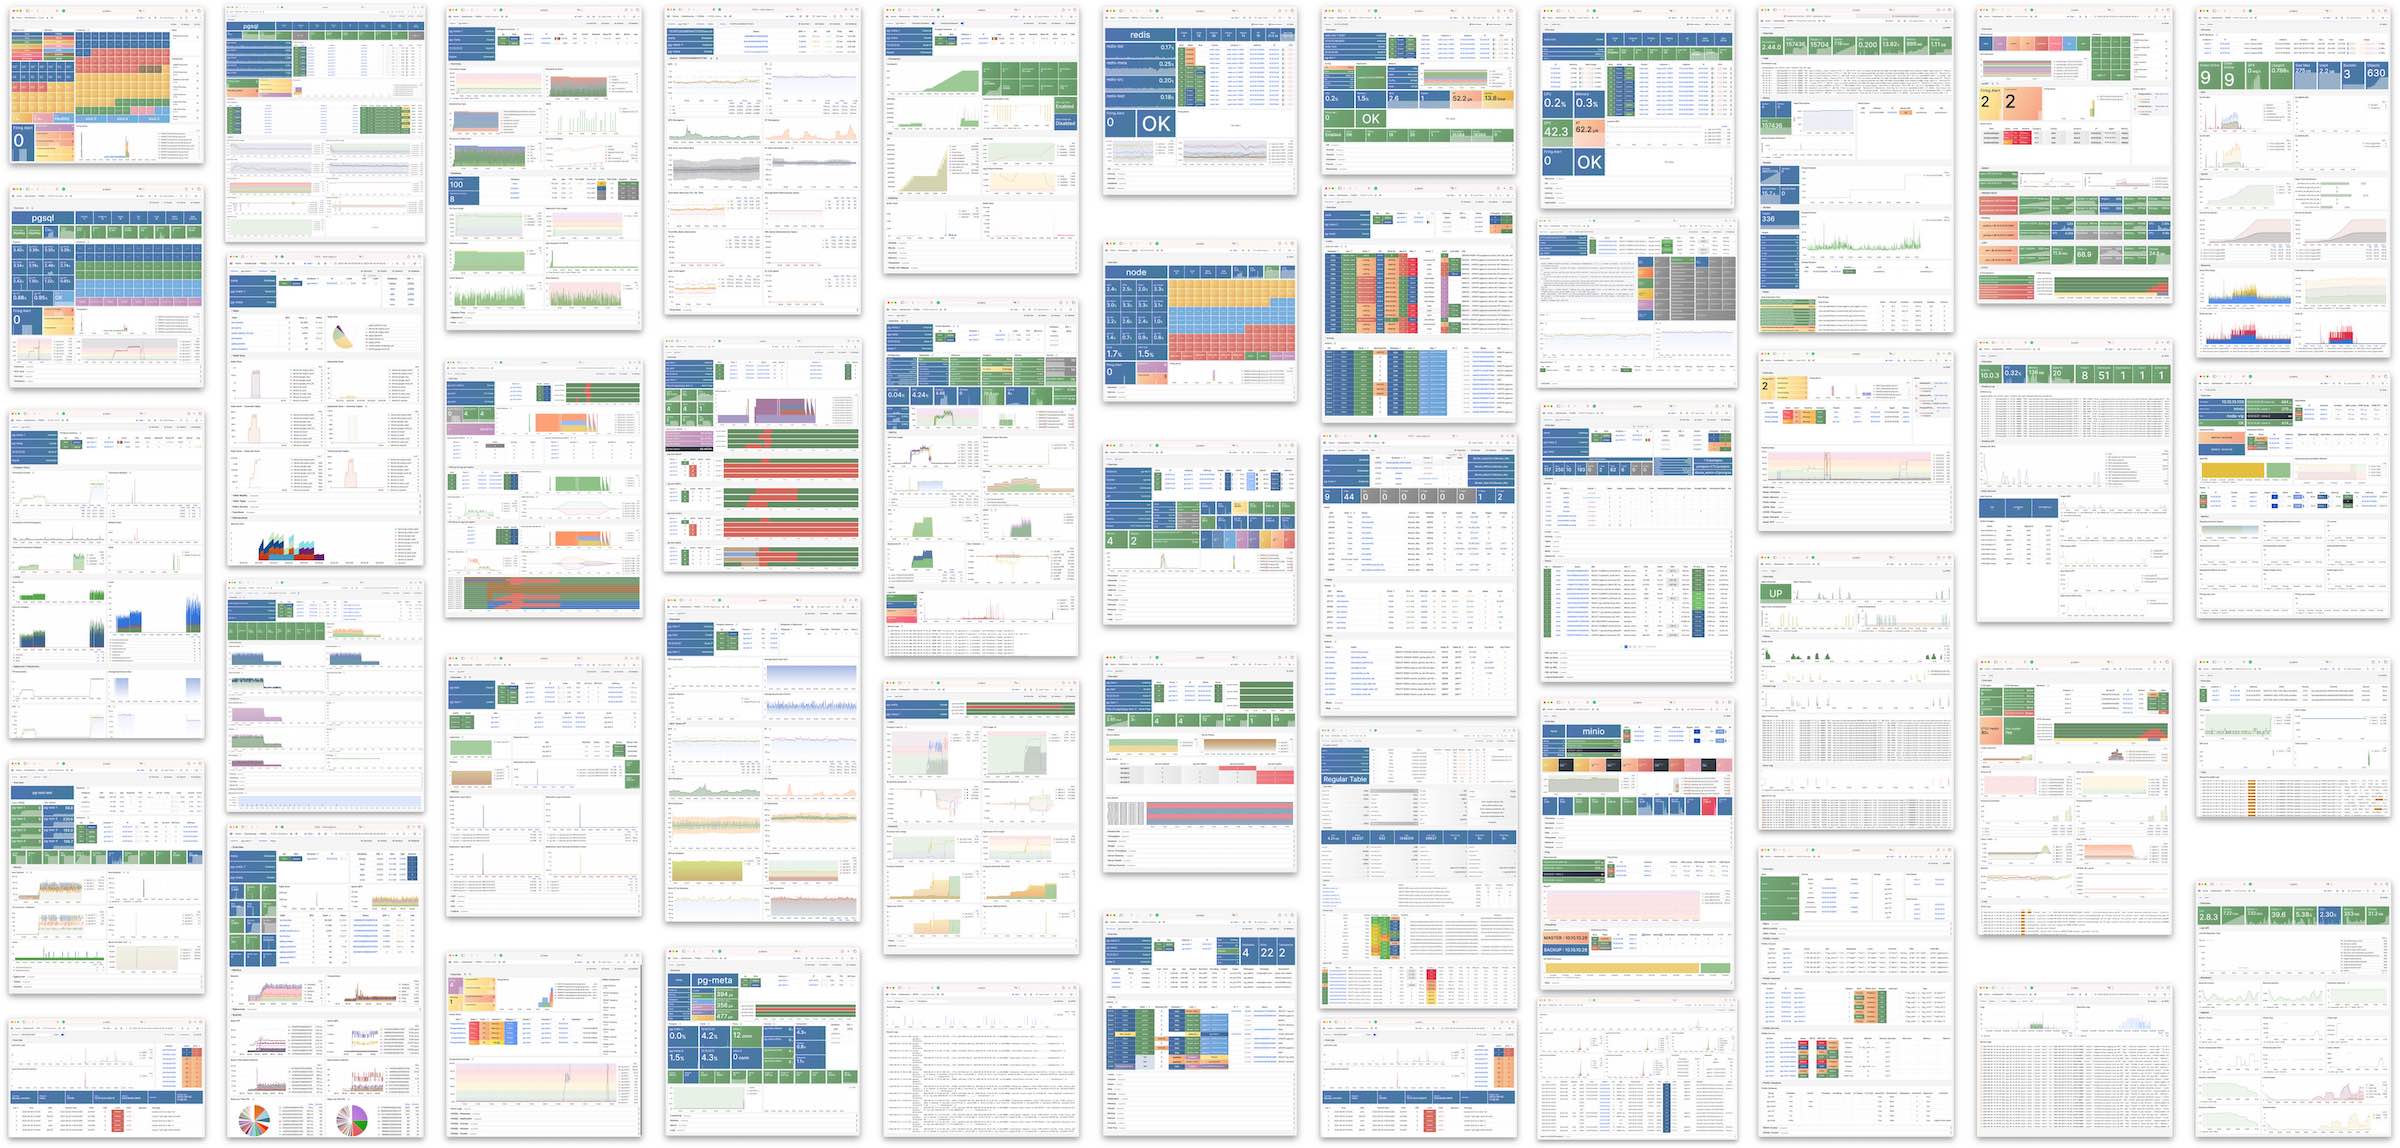
Check https://demo.pigsty.cc for live demo, which is built upon this exporter by Pigsty.
Usage
usage: pg_exporter [<flags>]


Flags:
  -h, --[no-]help            Show context-sensitive help (also try --help-long and --help-man).
  -u, --url=URL              postgres target url
  -c, --config=CONFIG        path to config dir or file
      --web.listen-address=:9630 ...
                             Addresses on which to expose metrics and web interface.
      --web.config.file=""   Path to configuration file that can enable TLS or authentication.
  -l, --label=""             constant lables:comma separated list of label=value pair ($PG_EXPORTER_LABEL)
  -t, --tag=""               tags,comma separated list of server tag ($PG_EXPORTER_TAG)
  -C, --[no-]disable-cache   force not using cache ($PG_EXPORTER_DISABLE_CACHE)
  -m, --[no-]disable-intro   disable collector level introspection metrics ($PG_EXPORTER_DISABLE_INTRO)
  -a, --[no-]auto-discovery  automatically scrape all database for given server ($PG_EXPORTER_AUTO_DISCOVERY)
  -x, --exclude-database="template0,template1,postgres"
                             excluded databases when enabling auto-discovery ($PG_EXPORTER_EXCLUDE_DATABASE)
  -i, --include-database=""  included databases when enabling auto-discovery ($PG_EXPORTER_INCLUDE_DATABASE)
  -n, --namespace=""         prefix of built-in metrics, (pg|pgbouncer) by default ($PG_EXPORTER_NAMESPACE)
  -f, --[no-]fail-fast       fail fast instead of waiting during start-up ($PG_EXPORTER_FAIL_FAST)
  -T, --connect-timeout=100  connect timeout in ms, 100 by default ($PG_EXPORTER_CONNECT_TIMEOUT)
  -P, --web.telemetry-path="/metrics"
                             URL path under which to expose metrics. ($PG_EXPORTER_TELEMETRY_PATH)
  -D, --[no-]dry-run         dry run and print raw configs
  -E, --[no-]explain         explain server planned queries
      --log.level="info"     log level: debug|info|warn|error]
      --log.format="logfmt"  log format: logfmt|json
      --[no-]version         Show application version.
Parameters could be given via command-line args or environment variables.
| CLI Arg | Environment Variable | Default Value |
|---|---|---|
--url | PG_EXPORTER_URL | postgres:/// |
--config | PG_EXPORTER_CONFIG | pg_exporter.yml |
--label | PG_EXPORTER_LABEL | |
--tag | PG_EXPORTER_TAG | |
--auto-discovery | PG_EXPORTER_AUTO_DISCOVERY | true |
--disable-cache | PG_EXPORTER_DISABLE_CACHE | false |
--fail-fast | PG_EXPORTER_FAIL_FAST | false |
--exclude-database | PG_EXPORTER_EXCLUDE_DATABASE | |
--include-database | PG_EXPORTER_INCLUDE_DATABASE | |
--namespace | PG_EXPORTER_NAMESPACE | pg|pgbouncer |
--connect-timeout | PG_EXPORTER_CONNECT_TIMEOUT | 100 |
--dry-run | false | |
--explain | false | |
--log.level | info | |
--log.format | logfmt | |
--web.listen-address | :9630 | |
--web.config.file | "" | |
--web.telemetry-path | PG_EXPORTER_TELEMETRY_PATH | /metrics |
API
PG Exporter provides a rich set of HTTP endpoints:
Here are pg_exporter REST APIs
# Fetch metrics (customizable)
curl localhost:9630/metrics

# Reload configuration
curl localhost:9630/reload

# Explain configuration
curl localhost:9630/explain

# Print Statistics
curl localhost:9630/stat

# Aliveness health check (200 up, 503 down)
curl localhost:9630/up
curl localhost:9630/health
curl localhost:9630/liveness
curl localhost:9630/readiness

# traffic route health check

### 200 if not in recovery, 404 if in recovery, 503 if server is down
curl localhost:9630/primary
curl localhost:9630/leader
curl localhost:9630/master
curl localhost:9630/read-write
curl localhost:9630/rw

### 200 if in recovery, 404 if not in recovery, 503 if server is down
curl localhost:9630/replica
curl localhost:9630/standby
curl localhost:9630/slave
curl localhost:9630/read-only
curl localhost:9630/ro

### 200 if server is ready for read traffic (including primary), 503 if server is down
curl localhost:9630/read
Tag summary
Content type
Image
Digest
sha256:3699f6fb7…
Size
5.1 MB
Last updated
2 months ago
docker pull pgsty/pg_exporter