prabushitha/gremlin-visualizer
Visualize the graph network corresponding to a gremlin query
100K+
prabushitha/gremlin-visualizer repository overview
Gremlin-Visualizer
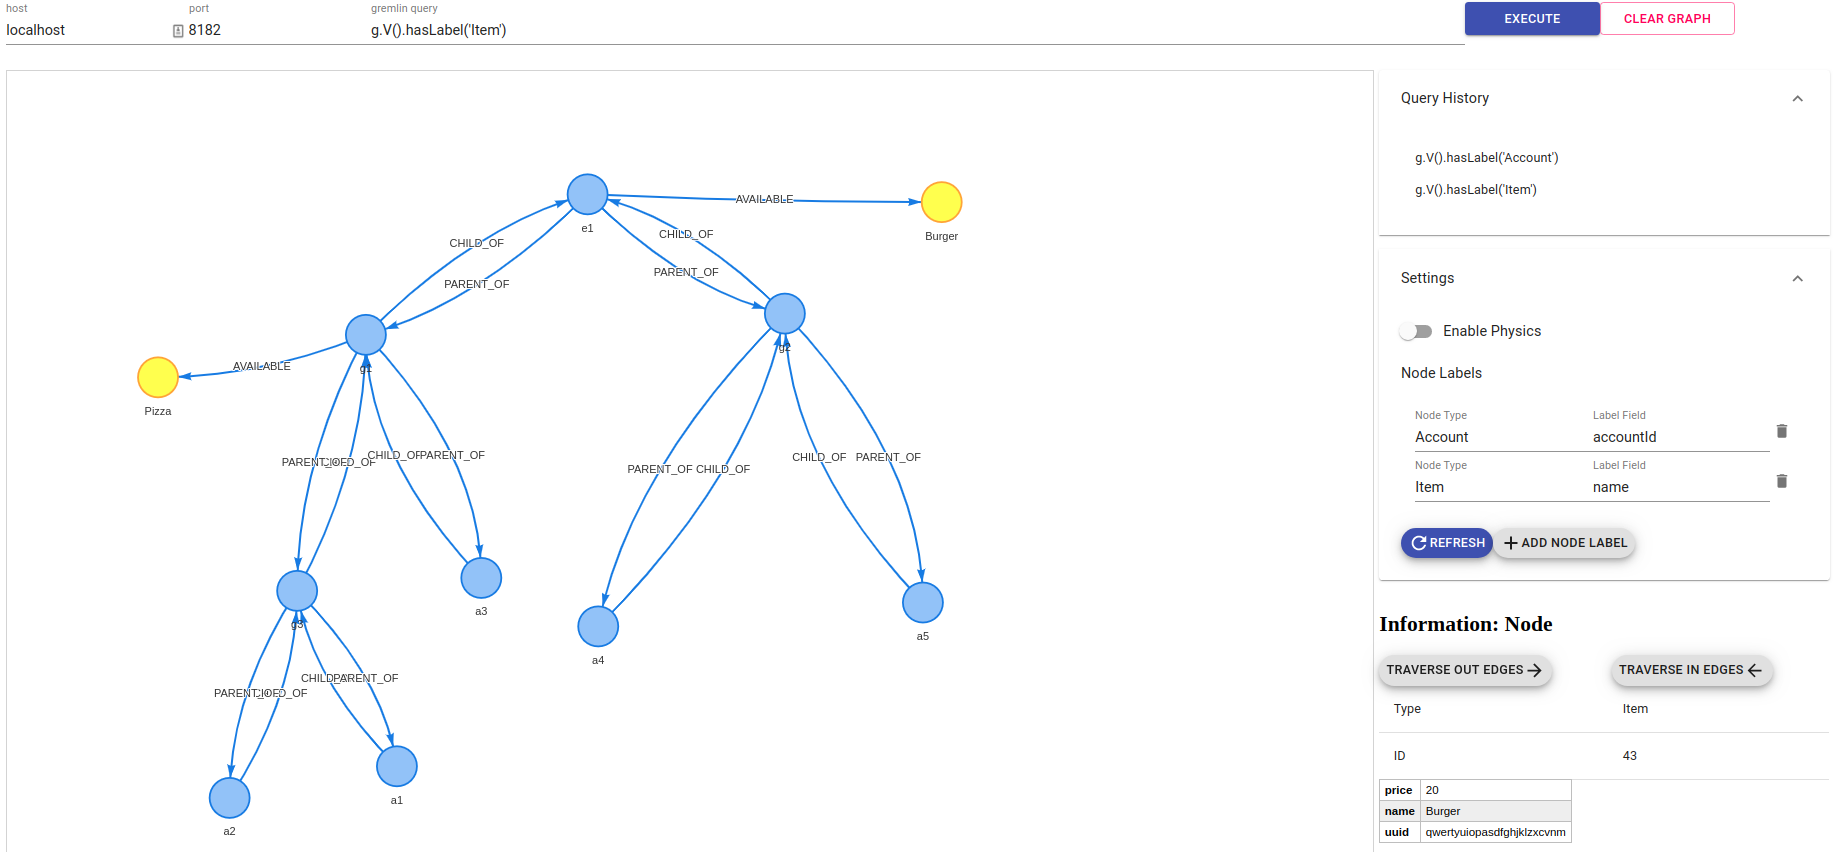
This project is to visualize the graph network corresponding to a gremlin query.
Setting Up Gremlin Visualizer
To setup gremlin visualizer, you need to have node.js and npm installed in your system.
- Clone the project
git clone https://github.com/prabushitha/gremlin-visualizer.git
- Install dependencies
npm install
- Run the project
npm start
- Open the browser and navigate to
http://localhost:3000
Note - Frontend starts on port 3000 and simple Node.js server also starts on port 3001. If you need to change the ports, configure in package.json, proxy-server.js, src/constants
Setting up with Docker
You can build a Docker image of the gremlin visualizer with the included Dockerfile.
This will use the current version of the master branch of the source GitHub repository.
The Docker image can be built by calling the docker build command, for example:
docker build --tag=gremlin-visualizer:latest .
The image can also be downloaded from Docker hub: prabushitha/gremlin-visualizer:latest.
docker pull prabushitha/gremlin-visualizer:latest
The Docker image can then be run by calling docker run and exposing the necessary ports for communication. See Docker's documentation for more options on how to run the image.
# if you built the image yourself
docker run --rm -d -p 3000:3000 -p 3001:3001 --name=gremlin-visualizer gremlin-visualizer:latest
# if you downloaded from Docker Hub
docker run --rm -d -p 3000:3000 -p 3001:3001 --name=gremlin-visualizer prabushitha/gremlin-visualizer:latest
The Docker container can be stopped by calling docker stop gremlin-visualizer.
Usage
- Start Gremlin-Visualizer as mentioned above
- Start or tunnel a gremlin server
- Specify the host and port of the gremlin server
- Write an gremlin query to retrieve a set of nodes (eg.
g.V())
Features
- If you don't clear the graph and execute another gremlin query, results of previous query and new query will be merged and be shown.
- Node and edge properties are shown once you click on a node/edge
- Change the labels of nodes to any property
- View the set of queries executed to generate the graph
- Traverse in/out from the selected node
Contributors
- Umesh Jayasinghe (Github: prabushitha)
Something Missing?
If you have new ideas to improve please create a issue and make a pull request
Tag summary
Content type
Image
Digest
Size
111.9 MB
Last updated
almost 7 years ago
docker pull prabushitha/gremlin-visualizer