rockaut/pgwatch2 repository overview
pgwatch2
Flexible self-contained PostgreSQL metrics monitoring/dashboarding solution
Demo
Note: has a self-signed certificate as configured out the box in Docker, so you need to click "Allow / Add exception / Trust" or similar
Installing
For the fastest installation / setup experience Docker images are provided via Docker Hub (for a Docker quickstart see here). For doing a custom setup see the "Installing without Docker" paragraph below or turn to the "releases" tab for DEB / RPM / Tar packages.
# fetch and run the latest Docker image, exposing Grafana on port 3000 and administrative web UI on 8080
docker run -d -p 3000:3000 -p 8080:8080 -e PW2_TESTDB=true --name pw2 cybertec/pgwatch2
After some minutes you could open the "db-overview" dashboard and start looking at metrics. For defining your own dashboards you need to log in as admin (admin/pgwatch2admin). NB! If you don't want to add the "test" database (the pgwatch2 configuration db) for monitoring set the NOTESTDB=1 env parameter when launching the image.
For production setups without a container management framework also "--restart unless-stopped" (or custom startup scripts) is highly recommended. Also exposing the config/metrics database ports for backups and usage of volumes is then recommended to enable easier updating to newer pgwatch2 Docker images without going through the backup/restore procedure described towards the end of README. For maximum flexibility, security and update simplicity though, best would to do a custom setup - see paragraph "Installing without Docker" towards the end of README for that.
for v in pg influx grafana pw2 ; do docker volume create $v ; done
# with InfluxDB for metrics storage
docker run -d --name pw2 -v pg:/var/lib/postgresql -v influx:/var/lib/influxdb -v grafana:/var/lib/grafana -v pw2:/pgwatch2/persistent-config -p 8080:8080 -p 3000:3000 -e PW2_TESTDB=true cybertec/pgwatch2
# with Postgres for metrics storage
docker run -d --name pw2 -v pg:/var/lib/postgresql -v grafana:/var/lib/grafana -v pw2:/pgwatch2/persistent-config -p 8080:8080 -p 3000:3000 -e PW2_TESTDB=true cybertec/pgwatch2-postgres
For more advanced usecases (production setup with backups) or for easier problemsolving you can decide to expose all services
# run with all ports exposed
docker run -d --restart unless-stopped -p 3000:3000 -p 5432:5432 -p 8086:8086 -p 8080:8080 -p 8081:8081 -p 8088:8088 -v ... --name pw2 cybertec/pgwatch2
NB! For production usage make sure you also specify listening IPs explicitly (-p IP:host_port:container_port), by default Docker uses 0.0.0.0 (all network devices).
For custom options, more security, or specific component versions one could easily build the image themselves, just Docker needed:
docker build .
For a complete list of all supported Docker environment variables see ENV_VARIABLES.md
Features
- Non-invasive setup, no extensions nor superuser rights required for the base functionality
- Intuitive metrics presentation using the Grafana dashboarding engine with optional Alerting
- Lots of pre-configured dashboards and metric configurations covering all Statistics Collector data
- Easy extensibility by defining metrics in pure SQL (thus they could also be from business domain)
- 4 supported data stores for metrics storage (PostgreSQL, InfluxDB, Graphite, Prometheus)
- Multiple configuration options (YAML, PostgreSQL, ENV) supporting both "push" and "pull" models
- Possible to monitoring all or a subset of DBs of a PostgreSQL cluster
- Global or DB level configuration of metrics/intervals
- Kubernetes/OpenShift ready
- PgBouncer, AWS RDS and Patroni support
- Internal health-check API to monitor metrics gathering status
- Built-in security with SSL connections and passwords encryption
- Very low resource requirements for the collector even when monitoring hundreds of DBs
Project background
For more background on the project motivations and design goals see the original series of blogposts announcing the project:
- Project announcement
- Implementation details
- Feature pack 1
- Feature pack 2
- Feature pack 3
- Feature pack 4
Limitations / Performance expectations
- Min 1GB RAM required for Docker setup. Just the gatherer needs <50MB if metric strore is up, otherwise metrics are cached in RAM up to a limit of 10k data points.
- 2 GBs of disk space should be enough for monitoring 1 DB for 1 month with InfluxDB. 1 month is also the default metrics retention policy for Influx running in Docker (configurable). Depending on the amount of schema objects - tables, indexes, stored procedures and especially on number of unique SQL-s, it could be also much more. With Postgres as metric store multiply it with ~5x. There's also a "test data generation" mode in the collector to exactly determine disk footprint - see PW2_TESTDATA_DAYS and PW2_TESTDATA_MULTIPLIER params for that (requires also "ad-hoc" mode params).
- A low-spec (1 vCPU, 2 GB RAM) cloud machine can easily monitor 100 DBs in "exhaustive" settings (i.e. almost all metrics are monitored in 1-2min intervals) without breaking a sweat (<20% load). When a single node where the metrics collector daemon is running is becoming a bottleneck, one can also do "sharding" i.e. limit the amount of monitored databases for that node based on the Group label(s) (--group), which is just a string for logical grouping.
- A single InfluxDB node should handle thousands of requests per second but if this is not enough having a secondary/mirrored InfluxDB is also possible. If more than two needed (e.g. feeding many many Grafana instances or some custom exporting) one should look at Influx Enterprise (on-prem or cloud) or Graphite (which is also supported as metrics storage backend). For PostgreSQL metrics storage one could use streaming replicas for read scaling or for example Citus for write scaling.
- When high metrics write latency is problematic (e.g. using a DBaaS across the atlantic) then increasing the default maximum batching delay of 250ms(--batching-delay-ms / PW2_BATCHING_MAX_DELAY_MS) could give good results.
Security/safety aspects
Settings can be configured for most components, but by default the Docker image doesn't focus on security though but rather on being quickly usable for ad-hoc performance troubleshooting.
- No noticable impact for the monitored DB is expected with the default settings. For some metrics though can happen that the metric reading query (notably "stat_statements") takes some milliseconds, which might be more than an average application query. At any time only 2 metric fetching queries are running in parallel on the monitored DBs, with 5s per default "statement timeout", except for the "bloat" metrics where it is 15min.
- Starting from v1.3.0 there's a non-root Docker version available (suitable for OpenShift)
- The administrative Web UI doesn't have by default any security. Configurable via env. variables.
- Viewing Grafana dashboards by default doesn't require login. Editing needs a password. Configurable via env. variables.
- InfluxDB has no authentication in Docker setup, so one should just not expose the ports when having concerns.
- Dashboards based on "pg_stat_statements" (Stat Statement Overview / Top) expose actual queries. They are mostly stripped of details though, but if no risks can be taken the dashboards (or at least according panels) should be deleted. As an alternative "pg_stat_statements_calls" can be used, which only records total runtimes and call counts.
- Safe certificate connections to Postgres are supported as of v1.5.0
- Encrypting/decrypting passwords stored in the config DB or in YAML config files possible from v1.5.0. An encryption passphrase/file needs to be specified then via PW2_AES_GCM_KEYPHRASE / PW2_AES_GCM_KEYPHRASE_FILE. By default passwords are stored in plaintext.
Alerting
Alerting is very conveniently (point-and-click style) provided by Grafana - see here for documentation. All most popular notification services are supported. A hint - currently you can set alerts only on Graph panels and there must be no variables used in the query so you cannot use most of the pre-created pgwatch2 graphs. There's s template named "Alert Template" though to give you some ideas on what to alert on.
If more complex scenarios/check conditions are required TICK stack and Kapacitor can be easily integrated - see here for more details.
Components
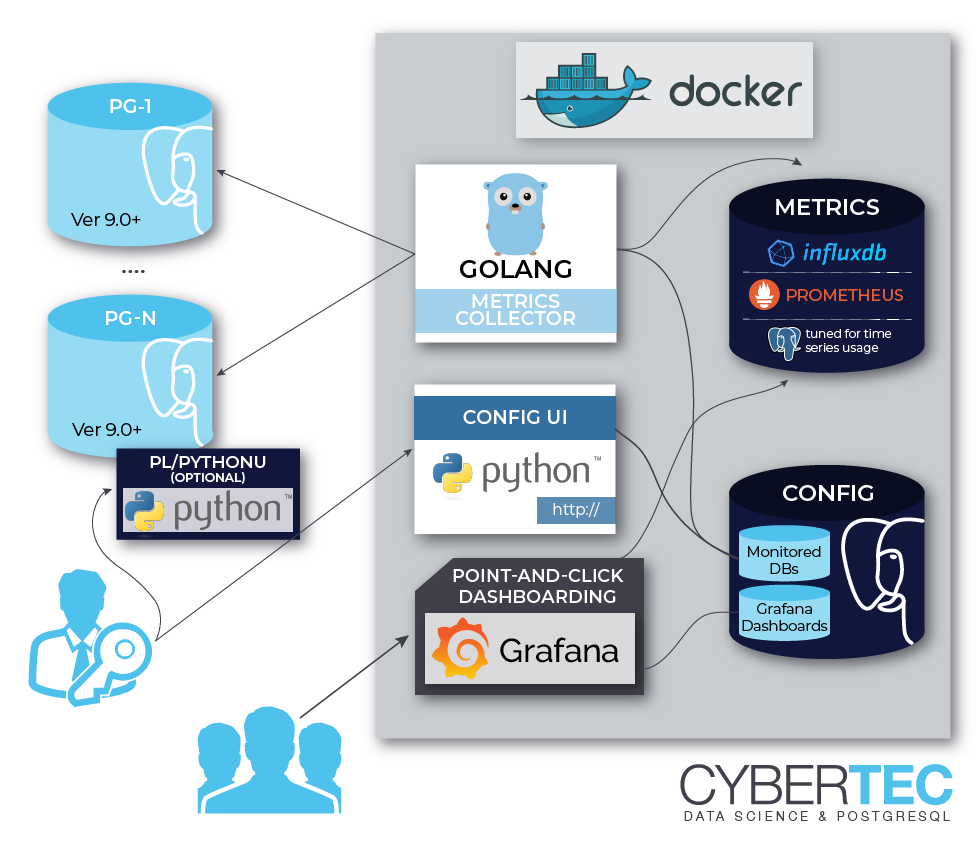
- pgwatch2 metrics gathering daemon / collector written in Go
- Configuration store saying which databases and metrics to gather (3 options):
- A PostgreSQL database
- YAML config files + SQL metrics files
- A temporary "ad-hoc" config i.e. just a single connect string (JDBC or Libpq type) for "throwaway" usage
- Metrics storage DB (4 options)
- InfluxDB Time Series Database for storing metrics.
- PostgreSQL - world's most advanced Open Source RDBMS (based on JSONB, 9.4+ required). See "To use an existing Postgres DB for storing metrics" section below for setup details.
- Graphite (no custom_tags and request batching support)
- JSON files (for testing / special use cases)
- Grafana for dashboarding (point-and-click, a set of predefined dashboards is provided)
- An optional simple Web UI for administering the monitored DBs and metrics and for showing some custom metric overviews, if using PostgreSQL for storing config
NB! All component can be also used separately, thus you can decide to make use of an already existing installation of Postgres, Grafana or InfluxDB and run the pgwatch2 image for example only with the metrics gatherer and the configuration Web UI. These external installations must be accessible from within the Docker though. For info on installation without Docker at all see end of README.
Component diagram for default Docker setup
To use an existing Postgres DB for storing the monitoring config
Create a new pgwatch2 DB, preferrably also an accroding role who owns it. Then roll out the schema (pgwatch2/sql/config_store/config_store.sql) and set the following parameters when running the image: PW2_PGHOST, PW2_PGPORT, PW2_PGDATABASE, PW2_PGUSER, PW2_PGPASSWORD, PW2_PGSSL (optional).
To use an existing Grafana installation
Load the pgwatch2 dashboards from grafana_dashboard folder if needed (one can totally define their own) and set the following paramater: PW2_GRAFANA_BASEURL. This parameter only provides correct links to Grafana dashboards from the Web UI. Grafana is the most loosely coupled component for pgwatch2 and basically doesn't have to be used at all. One can make use of the gathered metrics directly over the Influx (or Graphite) API-s.
To use an existing InfluxDB installation
Set the following env variables: PW2_IHOST, PW2_IPORT, PW2_IDATABASE, PW2_IUSER, PW2_IPASSWORD, PW2_ISSL (optional)
To use an existing Graphite installation
One can also store the metrics in Graphite instead of InfluxDB (no predefined pgwatch2 dashboards for Graphite though). Following parameters needs to be set then: PW2_DATASTORE=graphite, PW2_GRAPHITEHOST, PW2_GRAPHITEPORT
To use an existing Postgres DB for storing metrics
- Roll out the metrics storage schema according to instructions from here
- Following parameters needs to be set for the gatherer:
- --datastore=postgres or PW2_DATASTORE=postgres
- --pg-metric-store-conn-str="postgresql://user:pwd@host:port/db" or PW2_PG_METRIC_STORE_CONN_STR="..."
- optionally also adjust the --pg-retention-days parameter. By default 30 days (at least) of metrics are kept
- If using the Web UI also set the first two parameters (--datastore and --pg-metric-store-conn-str) there, if wanting to clean up data via the UI.
NB! The schema rollout script activates "asynchronous commiting" feature for the metrics storing user role by default!
If this is not wanted (no metrics can be lost in case of a crash), then re-enstate normal (synchronous) commits with:
ALTER ROLE pgwatch2 IN DATABASE $MY_METRICS_DB SET synchronous_commit TO on
Usage (Docker based, for file or ad-hoc based see further below)
- by default the "pgwatch2" configuration database running inside Docker is being monitored so that you can immediately see some graphs, but you should add new databases by opening the "admin interface" at 127.0.0.1:8080/dbs or logging into the Postgres config DB and inserting into "pgwatch2.monitored_db" table (db - pgwatch2 , default user/pw - pgwatch2/pgwatch2admin). Note that it can take up to 2min before you see any metrics for newly inserted databases.
- one can create new Grafana dashboards (and change settings, create users, alerts, ...) after logging in as "admin" (admin/pgwatch2admin)
- metrics (and their intervals) that are to be gathered can be customized for every database by using a preset config like "minimal", "basic" or "exhaustive" (monitored_db.preset_config table) or a custom JSON config.
- to add a new metrics yourself (simple SQL queries returing point-in-time values) head to http://127.0.0.1:8080/metrics. The queries should always include a "epoch_ns" column and "tag_" prefix can be used for columns that should be tags (thus indexed) in InfluxDB.
- a list of available metrics together with some instructions is also visible from the "Documentation" dashboard
- some predefine metrics (cpu_load, stat_statements) require installing helper functions (look into "pgwatch2/sql" folder) on monitored DBs
- for effective graphing you want to familiarize yourself with basic InfluxQL and the non_negative_derivative() function which is very handy as Postgres statistics are mostly evergrowing counters. Documentation here.
- for troubleshooting, logs for the components are visible under http://127.0.0.1:8080/logs/[pgwatch2|postgres|webui|influxdb|grafana] or by logging into the docker container under /var/logs/supervisor/
Steps to configure your database for monitoring
- As a base requirement you'll need a login user (non-superuser suggested) for connecting to your server and fetching metrics queries. NB! Though theoretically you can use any username you like, but if not using "pgwatch2" you need to adjust the "helper" creation SQL scripts accordingly as in those by default only the "pgwatch2" will be granted execute privileges.
CREATE ROLE pgwatch2 WITH LOGIN PASSWORD 'secret';
-- NB! For very important databases it might make sense to ensure that the user
-- account used for monitoring can only open a limited number of connections (there are according checks in code also though)
ALTER ROLE pgwatch2 CONNECTION LIMIT 3;
GRANT pg_monitor TO pgwatch2;   // v10+
- If monitoring below v10 servers and not using superuser and don't also want to grant "pg_monitor" to the monitoring user, define the helper function to enable monitoring of some "protected" internal information, like active sessions info. If using a superuser login (not recommended for remote "pulling", but only "pushing") you can skip this step.
psql -h mydb.com -U superuser -f pgwatch2/sql/metric_fetching_helpers/stat_activity_wrapper.sql mydb
- Additionally for extra insights ("Stat statements" dashboard and CPU load) it's also recommended to install the
pg_stat_statementcontrib extension (Postgres 9.2+ needed to be useful for pgwatch2) and the PL/Python language. The latter one though is usually disabled by DB-as-a-service providers for security reasons. For maximum pg_stat_statement benefit ("Top queries by IO time" dashboard), one should also then enable the track_io_timing setting.
# add pg_stat_statements to your postgresql.conf and restart the server
shared_preload_libraries = 'pg_stat_statements'
After restarting the server install the extensions as superuser
CREATE EXTENSION pg_stat_statements;
CREATE EXTENSION plpythonu;
Now also install the wrapper functions (under superuser role) for enabling "Stat statement" and CPU load info fetching for non-superusers
psql -h mydb.com -U superuser -f pgwatch2/sql/metric_fetching_helpers/stat_statements_wrapper.sql mydb
psql -h mydb.com -U superuser -f pgwatch2/sql/metric_fetching_helpers/cpu_load_plpythonu.sql mydb
For more detailed statistics (OS monitoring, table bloat, WAL size, etc) it is recommended to install also all other helpers
found from the pgwatch2/sql/metric_fetching_helpers folder (or pgwatch2/metrics/00_helpers for YAML based setup).
As of v1.6.0 though helpers are not needed for Postgres-native metrics (e.g. WAL size) if a privileged user (superuser or has pg_monitor GRANT)
is used as all Postres-protected metrics have also "privileged" SQL-s defined for direct access. Another good way to take
ensure that helpers get installed is to 1st run as superuser, by checking the Auto-create helpers? checkbox
(or "is_superuser: true" in YAML mode) when configuring databases and then switch to the normal unprivileged "pgwatch2" user.
NB! When rolling out helpers make sure the search_path is set correctly (same as monitoring role's) as metrics using the
helpers, assume that monitoring role's search_path includes everything needed i.e. they don't qualify any schemas.
Warning / notice on using metric fetching helpers
-
When installing some "helpers" and laters doing a binary PostgreSQL upgrade via
pg_upgrade, this could result in some error messages thrown. Then just drop those failing helpers on the "to be upgraded" cluster and re-create them after the upgrade process. -
Starting from Postgres v10 helpers are mostly not needed (only for PL/Python ones getting OS statistics) - there are available some special monitoring roles like "pg_monitor", that are exactly meant to be used for such cases where we want to give access to all Statistics Collector views without any other "superuser behaviour". See here for documentation on such special system roles. Note that currently most out-of-the-box metrics first rely on the helpers as v10 is relatively new still, and only when fetching fails, direct access with the "Privileged SQL" is tried.
-
For gathering OS statistics (CPU, IO, disk) there are helpers and metrics provided, based on the "psutil" Python package...but from user reports seems the package behaviour differentiates slightly based on the Linux distro / Kernel version used, so small adjustments might be needed there (e.g. remove a non-existen column). Minimum usable Kernel version required is 3.3. Also note that SQL helpers functions are currently defined for Python 2, so for Python 3 you need to change the
LANGUAGE plpythonupart.
Running without helper / wrapper functions
Helpers/wrappers are not needed actually, they just provide a bit more information. For unprivileged users (developers)
with no means to install any wrappers as superuser it's also possible to benefit from pgwatch2 - for such use cases e.g.
the "unprivileged" preset metrics profile and the according "DB overview Unprivileged / Developer" dashboard
is a good starting point as it only assumes existance of pg_stat_statements which is available at all cloud providers.
Screenshot of the "DB overview" dashboard

More screenshots here
Technical details
- Dynamic management of monitored databases, metrics and their intervals - no need to restart/redeploy
- Safety
- Up to 2 concurrent queries per monitored database (thus more per cluster) are allowed
- Configurable statement timeouts per DB
- SSL connections support for safe over-the-internet monitoring (use "-e PW2_WEBSSL=1 -e PW2_GRAFANASSL=1" when launching Docker)
- Optional authentication for the Web UI and Grafana (by default freely accessible)
- Backup script (take_backup.sh) provided for taking snapshots of the whole Docker setup. To make it easier (run outside the container) one should to expose ports 5432 (Postgres) and 8088 (InfluxDB backup protocol) at least for the loopback address.
Ports exposed by the Docker image:
- 5432 - Postgres configuration (or metrics storage) DB
- 8080 - Management Web UI (monitored hosts, metrics, metrics configurations)
- 8081 - Gatherer healthcheck / statistics on number of gathered metrics (JSON).
- 3000 - Grafana dashboarding
- 8086 - InfluxDB API (when using the InfluxDB version)
- 8088 - InfluxDB Backup port (when using the InfluxDB version)
The Admin Web UI
In the centrally managed (config DB based) mode, for easy configuration changes (adding databases to monitoring, adding metrics) there is a small Python Web application bundled (exposed on Docker port 8080), making use of the CherryPy Web-framework. For mass changes one could technically also log into the configuration database and change the tables in the “pgwatch2” schema directly. Besides managing the metrics gathering configurations, the two other useful features for the Web UI would be the possibility to look at the logs of the single components (when using Docker) and at the “Stat Statements Overview” page, which will e.g. enable finding out the query with the slowest average runtime for a time period.
By default the Web UI is not secured. If some security is needed then the following env. variables can be used to enforce password protection - PW2_WEBNOANONYMOUS, PW2_WEBUSER, PW2_WEBPASSWORD.
By default also the Docker component logs (Postgres, Influx, Grafana, Go daemon, Web UI itself) are exposed via the "/logs" endpoint. If this is not wanted set the PW2_WEBNOCOMPONENTLOGS env. variable.
Different "DB types" explained
- postgres - connect data to a single to-be-monitored DB needs to be specified. When using the Web UI and "DB name" field is left empty, then as a one time operation, all non-template DB names are fetched, prefixed with "Unique name" field value and added to monitoring (if not already monitored). Internally monitoring always happens "per DB" not "per cluster".
- postgres-continuous-discovery - connect data to a Postgres cluster (w/o a DB name) needs to be specified and then the metrics daemon will periodically scan the cluster (connecting to the "template1" database, which is expected to exist) and add any found and not yet monitored DBs to monitoring. In this mode it's also possible to specify regular expressions to include/exclude some database names.
- pgbouncer - use to track metrics from PgBouncer's "SHOW STATS" command. In place of the Postgres "DB name" the name of a PgBouncer "pool" to be monitored must be inserted.
- patroni - Patroni is a HA / cluster manager for Postgres that relies on a DCS (Distributed Consensus Store) to store it's state. Typically in such a setup the nodes come and go and also it should not matter who is currently the master. To make it easier to monitor such dynamic constellations pgwatch2 supports reading of cluster node info from all supported DCS-s (etcd, Zookeeper, Consul), but currently only for simpler cases with no security applied (which is actually the common case in a trusted environment).
- patroni-continuous-discovery - as normal Patroni but all DB (or only those matching regex patterns) are monitored.
NB! "continuous" modes expect / need access to the "template1" DB of the specified cluster.
Patroni usage
When
Tag summary
Content type
Image
Digest
Size
624.7 MB
Last updated
almost 7 years ago
docker pull rockaut/pgwatch2