rungutancommunity/bash repository overview
Sentry Performance Monitoring
A reference of this article is available on the Rungutan Blog here -> https://rungutan.com/blog/sentry-performance-monitoring/.
What is Performance Monitoring?
Performance monitoring in web analytics is the act of regularly verifying and tracking how well and how consistently your digital platforms are performing. Tools for digital performance monitoring include dashboards and alert systems. By selecting a handful of strategic KPIs that you track regularly, you can easily monitor digital performance and take action if major changes in performance occur.
Performance Monitoring is basically a set of processes and tools to be able to determine how well fast applications are running in the cloud. Due to the nature of cloud applications being highly distributed, special software is required to be able to trace where traffic is going between networks and applications to truly understand how well an application is performing. There is an entire industry dedicated to measuring how well cloud applications, infrastructure, and networks perform, called Application Performance Monitoring (APM). APM tools will tell you the latency a user may expect on your website, or where a bottleneck in your network is based on telemetry it is measuring. APM tools are installed by developers and infrastructure engineers, and operations teams monitor these systems that are live to make sure all systems are healthy.
In short -> When your website brings home its report card.
What is Sentry?
Sentry is a service that helps you monitor and fix crashes in realtime. The server is in Python, but it contains a full API for sending events from any language, in any application.
With Performance Monitoring, teams can trace slow-loading pages back to its API call as well as surface all related errors. That way, Engineering Managers and Developers can resolve bottlenecks and deliver fast, reliable experiences that fit customer demands.
Web vitals
More important than understanding that there’s been an error is understanding how your users have been impacted by that error. By gathering field data (variable network speed, browser, device, region) via Google’s Web Vitals, Performance helps you understand what’s happening at your user’s level. Now you know whether your users are suffering from slow loading times, seeing unexpected changes, or having trouble interacting with the page.
Tracing
Trace poor-performing pages not only to its API call but to its children. Performance’s event detail waterfall visualizes your customer’s experience from beginning to end, all while connecting user device data to its expected operation.
Transaction monitoring
With performance monitoring, you can view transactions by slowest duration time, related issues, or the number of users — all in one consolidated view. And release markers add another layer of context so your team can gauge how customers react to code recently pushed to production.


How do I deploy it?
Let me make it clear before we go any further -> Sentry prides itself for being open-source but it does offer a cloud-based solution as a SaaS for those who do not want to deploy, manage and maintain the infrastructure for it.
There are a few community contributed ways of deploying it on premise if you do decide to not for the cloud version:
- One of the ways is use with docker-compose mentioned in one of Sentry's official GitHub repositories - getsentry/onpremise
- Another way is a community built HELM package available in this repo - sentry-kubernetes/charts
Both of these solutions though have some downsides, specifically:
- Scaling ingestion of events is a bit hard due to the hard capacity limits of both solutions
- It is a well known fact that database systems perform better on NON-docker infrastructure points
- Keeping up with the different changes in versions is usually a hassle
- Customizing the different bits and pieces such as integrations require a lot of man hours
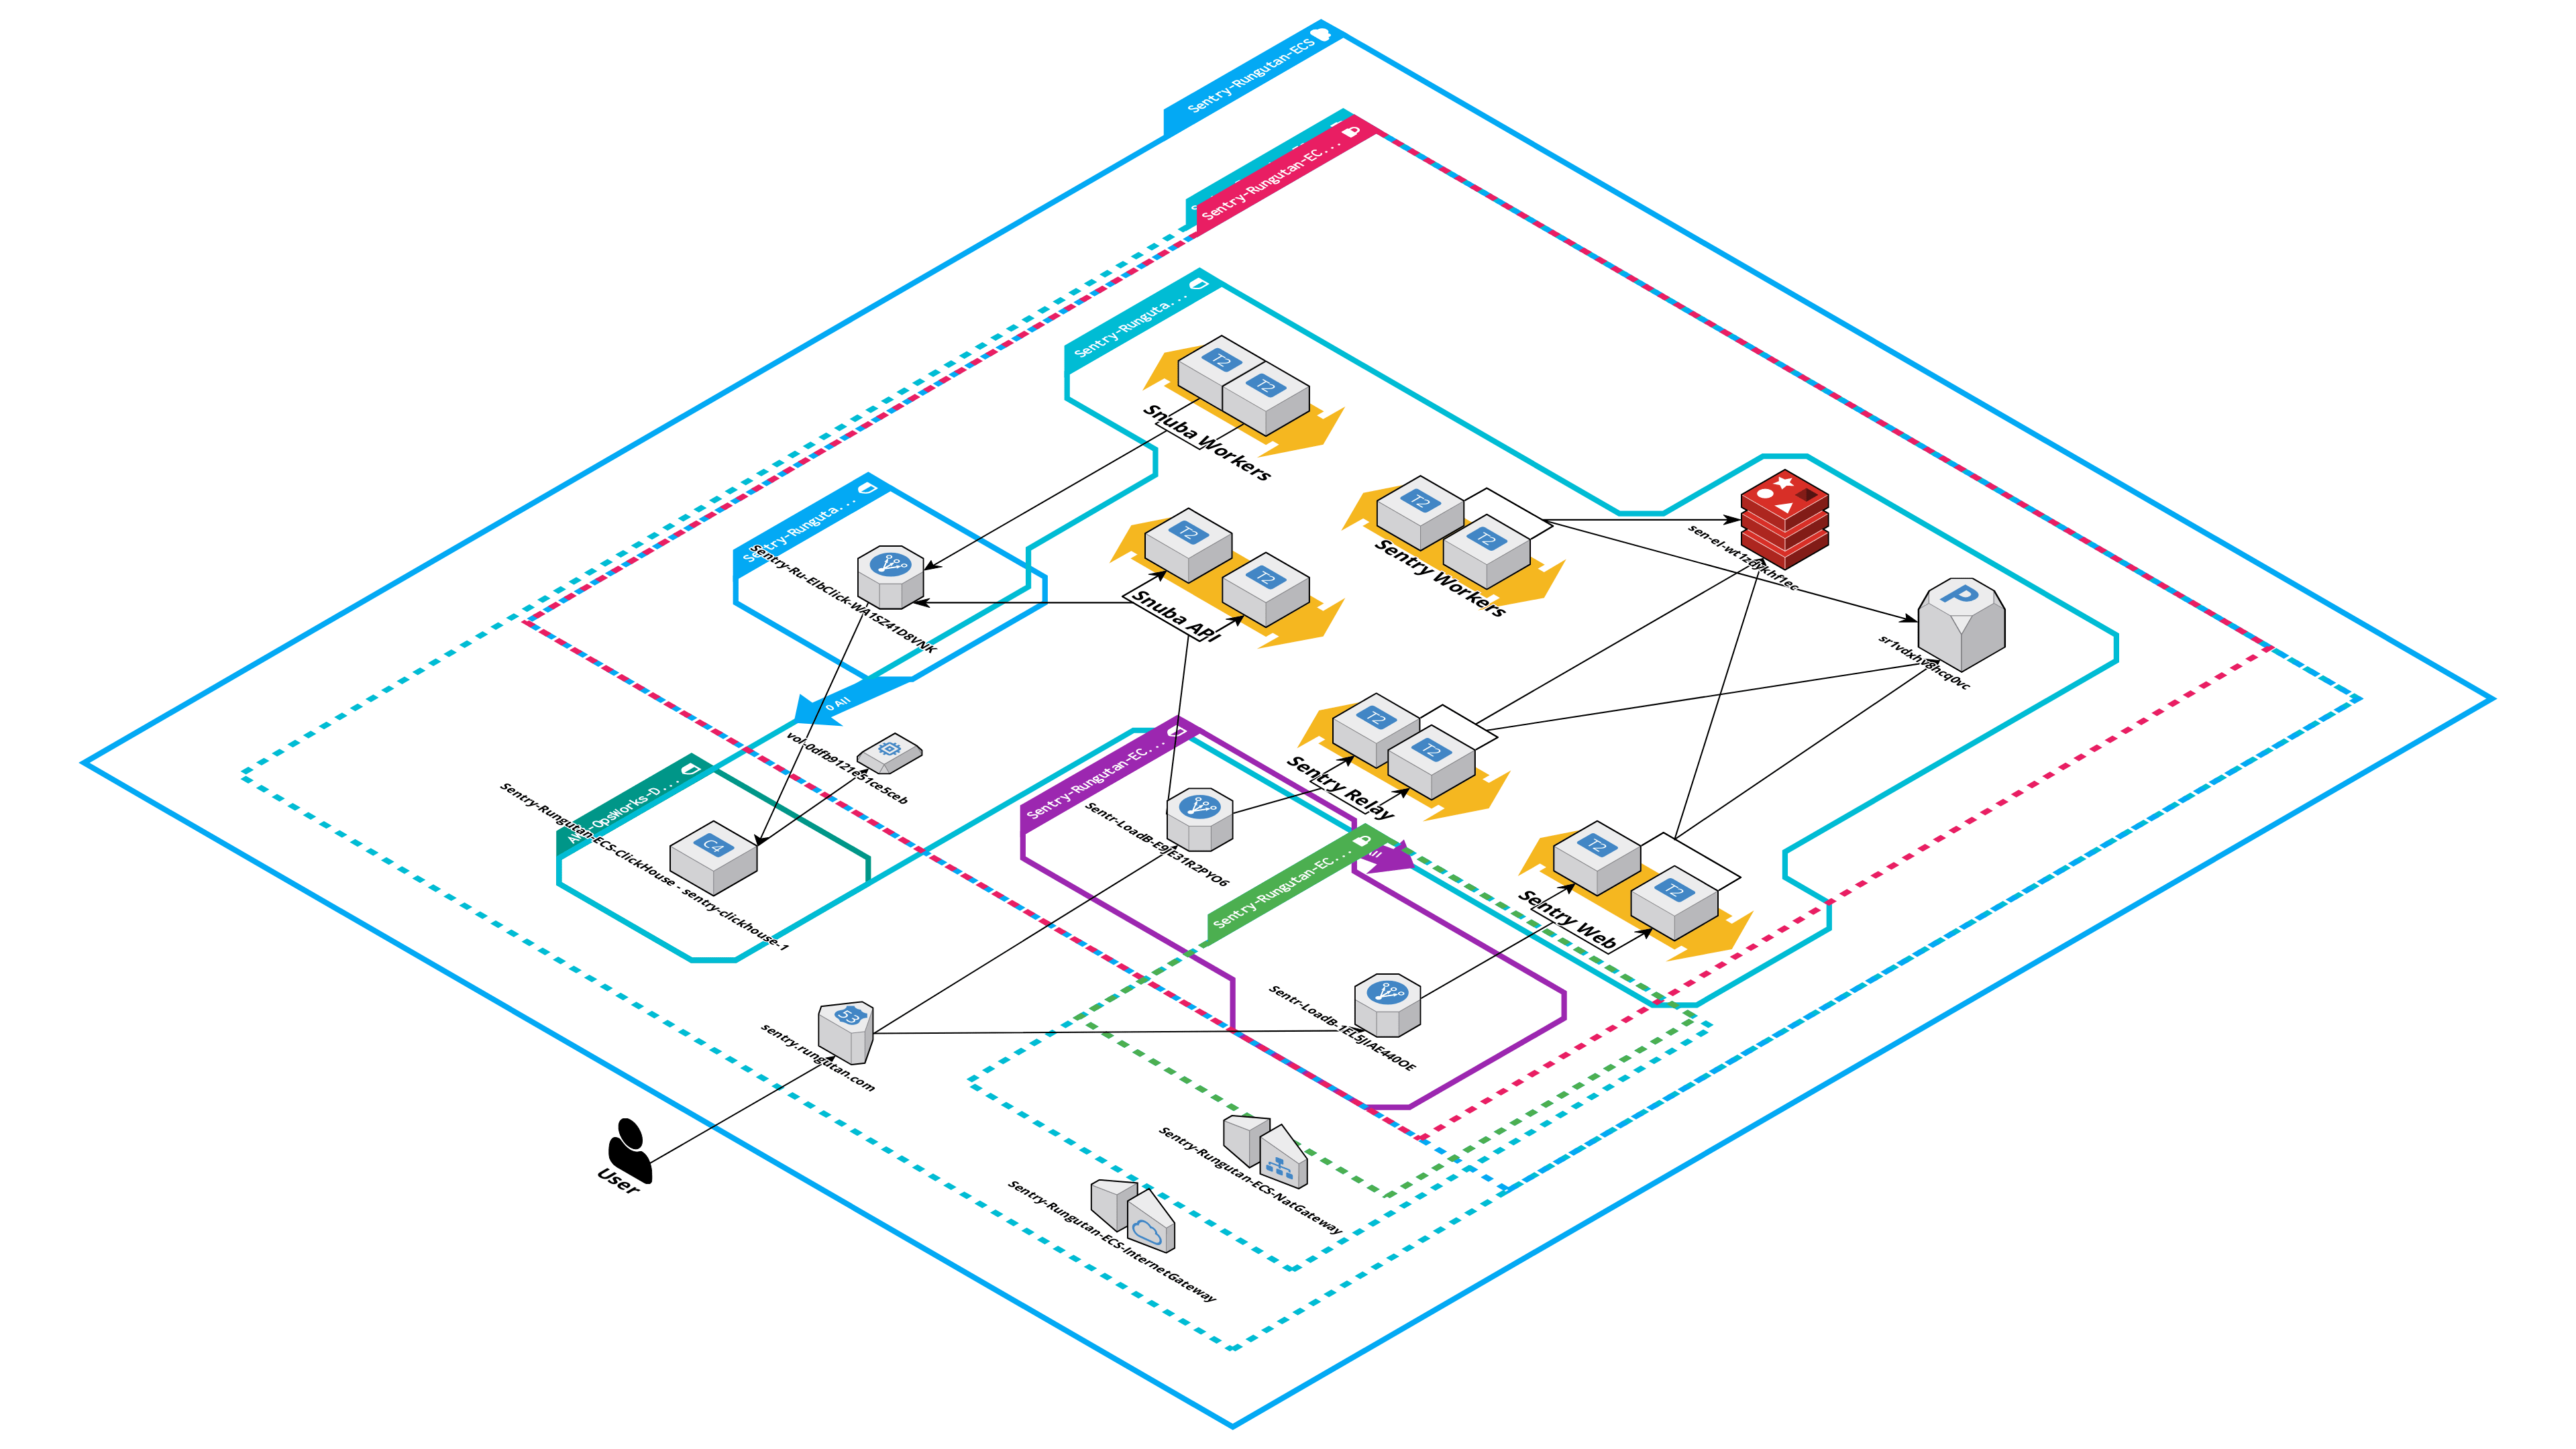
That's why, for those of you who use Amazon Web Services as their preferred cloud provider, we came in your help with a fully scalable, easy to maintain and secure infrastructure based on the following AWS services:
- AWS ECS Fargate
- AWS RDS
- AWS ElastiCache
- AWS MSK (Kafka)
- AWS OpsWorks
- AWS VPC
- AWS CloudWatch
Here's how a diagram of the deployed infrastructure looks like:
You can deploy it by following these simple steps:
- Create the stack in CloudFormation using this link -> https://console.aws.amazon.com/cloudformation/home#/stacks/create/review?templateURL=https://s3.us-east-1.amazonaws.com/sentry-performance-monitoring/cloudformation-template.yaml&stackName=Sentry-Rungutan-ECS
- Fill in AT LEAST these parameters and hit "Create stack":
- SentrySystemSecretKey -> You can use a random UUIDv4 that you can get from https://www.uuidgenerator.net/
- InitialAdminUserEmail -> A very strong password that you should set for the initial admin user
- InitialAdminUserPassword
- SslLoadBalancer -> Sentry cannot properly work without HTTPS and it is a requirement for this stack
- SentryEmailUsername -> We recommend SES for that and you can create a user/pass from https://console.aws.amazon.com/ses/home#smtp-settings:
- SentryEmailPassword -> We recommend SES for that and you can create a user/pass from https://console.aws.amazon.com/ses/home#smtp-settings:
- SentryEmailHost -> As mentioned in the description, the SES endpoint is email-smtp.${aws_region}.amazonaws.com
- SentryEmailFrom -> If using SES, a confirmed address (or domain) from https://console.aws.amazon.com/ses/home#verified-senders-email:
PS: It is recommended that you create your own administrators and delete the initial one after the initial deployment is done!
Integrations
Rungutan
As part of the CI/CD pipeline definition mentioned in // Article - How to include Load Testing in your CI / CD pipeline?, you would simple have to create METRIC ALERTS for monitoring in Sentry and include the load test into your pipeline:

For reference, a sample GitHub Actions pipeline for Rungutan looks like this:
name: Load test with Rungutan

on:
  release:
    types:
      - created

jobs:
  load:

    runs-on: ubuntu-latest

    steps:
    - uses: actions/checkout@v2

    - name: Load test your platform with Rungutan
      uses: Rungutan/[email protected]
      env:
        RUNGUTAN_TEAM_ID: ${{ secrets.RUNGUTAN_TEAM_ID }}
        RUNGUTAN_API_KEY: ${{ secrets.RUNGUTAN_API_KEY }}
        RUNGUTAN_TEST_FILE: test_file.json
        RUNGUTAN_TEST_NAME: ${{ github.repository }}-${{ github.ref }}
Slack
The Slack integration helps you set up a channel to receive alerts in your Slack organization and have your team members react on them by assigning it to specific people or resolving it in the current or next release.
The steps to set up the Slack integration are a bit complicated on the Slack side in order to get all the features you need, but not impossible!
In order to do it, you'd have to:
-
Go to https://api.slack.com/apps and click on Create New App, give it a name (eg "Sentry") and select your current workspace
-
Go to OAuth & Permissions, and set the following, click on Add New Redirect URL and set it as https://${SentryDnsRecord}/extensions/slack/setup/
-
While still on OAuth & Permissions, enable the following under Bot Token Scopes:
- incoming-webhook
- links:read
- links:write
- While still on OAuth & Permissions, enable the following under User Token Scopes:
- links:read
- links:write
- Go to the Interactivity & Shortcuts section, enable it and set the following:
- Request URL = https://${SentryDnsRecord}/extensions/slack/action/
- Options Load URL = https://${SentryDnsRecord}/extensions/slack/options-load/
-
Go to Event Subscriptions, enable it and set the Request URL as https://${SentryDnsRecord}/extensions/slack/event/
-
While still on Event Subscriptions, click on "Add Bot User Event" (within the "Subscribe to bot events" section) and include link_shared (if not already there)
-
While still on Event Subscriptions, click on "Add Domain" (within the "App unfurl domains" section) and include your Sentry DNS record in it
-
After all this is done, go back to Basic Information, click on Install App and write down the following resulting information that will be reused in your CloudFormation template:
- Client ID
- Client Secret
- Signing Secret
After you've finished the Slack definition of your application, then access Sentry and:
- Go to Settings
- Click on Integrations
- Click on Slack
- Click on Add WOrkspace
- Click on Allow
PS: In order to "benefit" fully from this Slack integration, you'll havet to perform these steps with an account that has the ADMIN privileges in Slack!
How do Sentry and Rungutan work together?
Rungutan and Sentry are two pieces of the same puzzle: capturing and observing user activity on your platform.
Your platform, along all other API platforms on the internet, is very sensitive. Any tweak, any non-optimium piece of code, any inappropriate change of infrastructure can create a huge ripple on your user's experience.
That's why, being in constant connection with your platform behaves at any moment in time, is of vital necessity to every technical person out there.
Let's be honest. These platforms are our babies. They're one of the best things that came out of our minds and they should be treated with the out-most respect the truly deserve.
That is exactly why load testing, monitoring and alerting after every release is of vital importance!.
In short -> Rungutan simulates high user activity and Sentry tells you the exact piece of code causing problems at scale.
Yes, we use it ourselves!
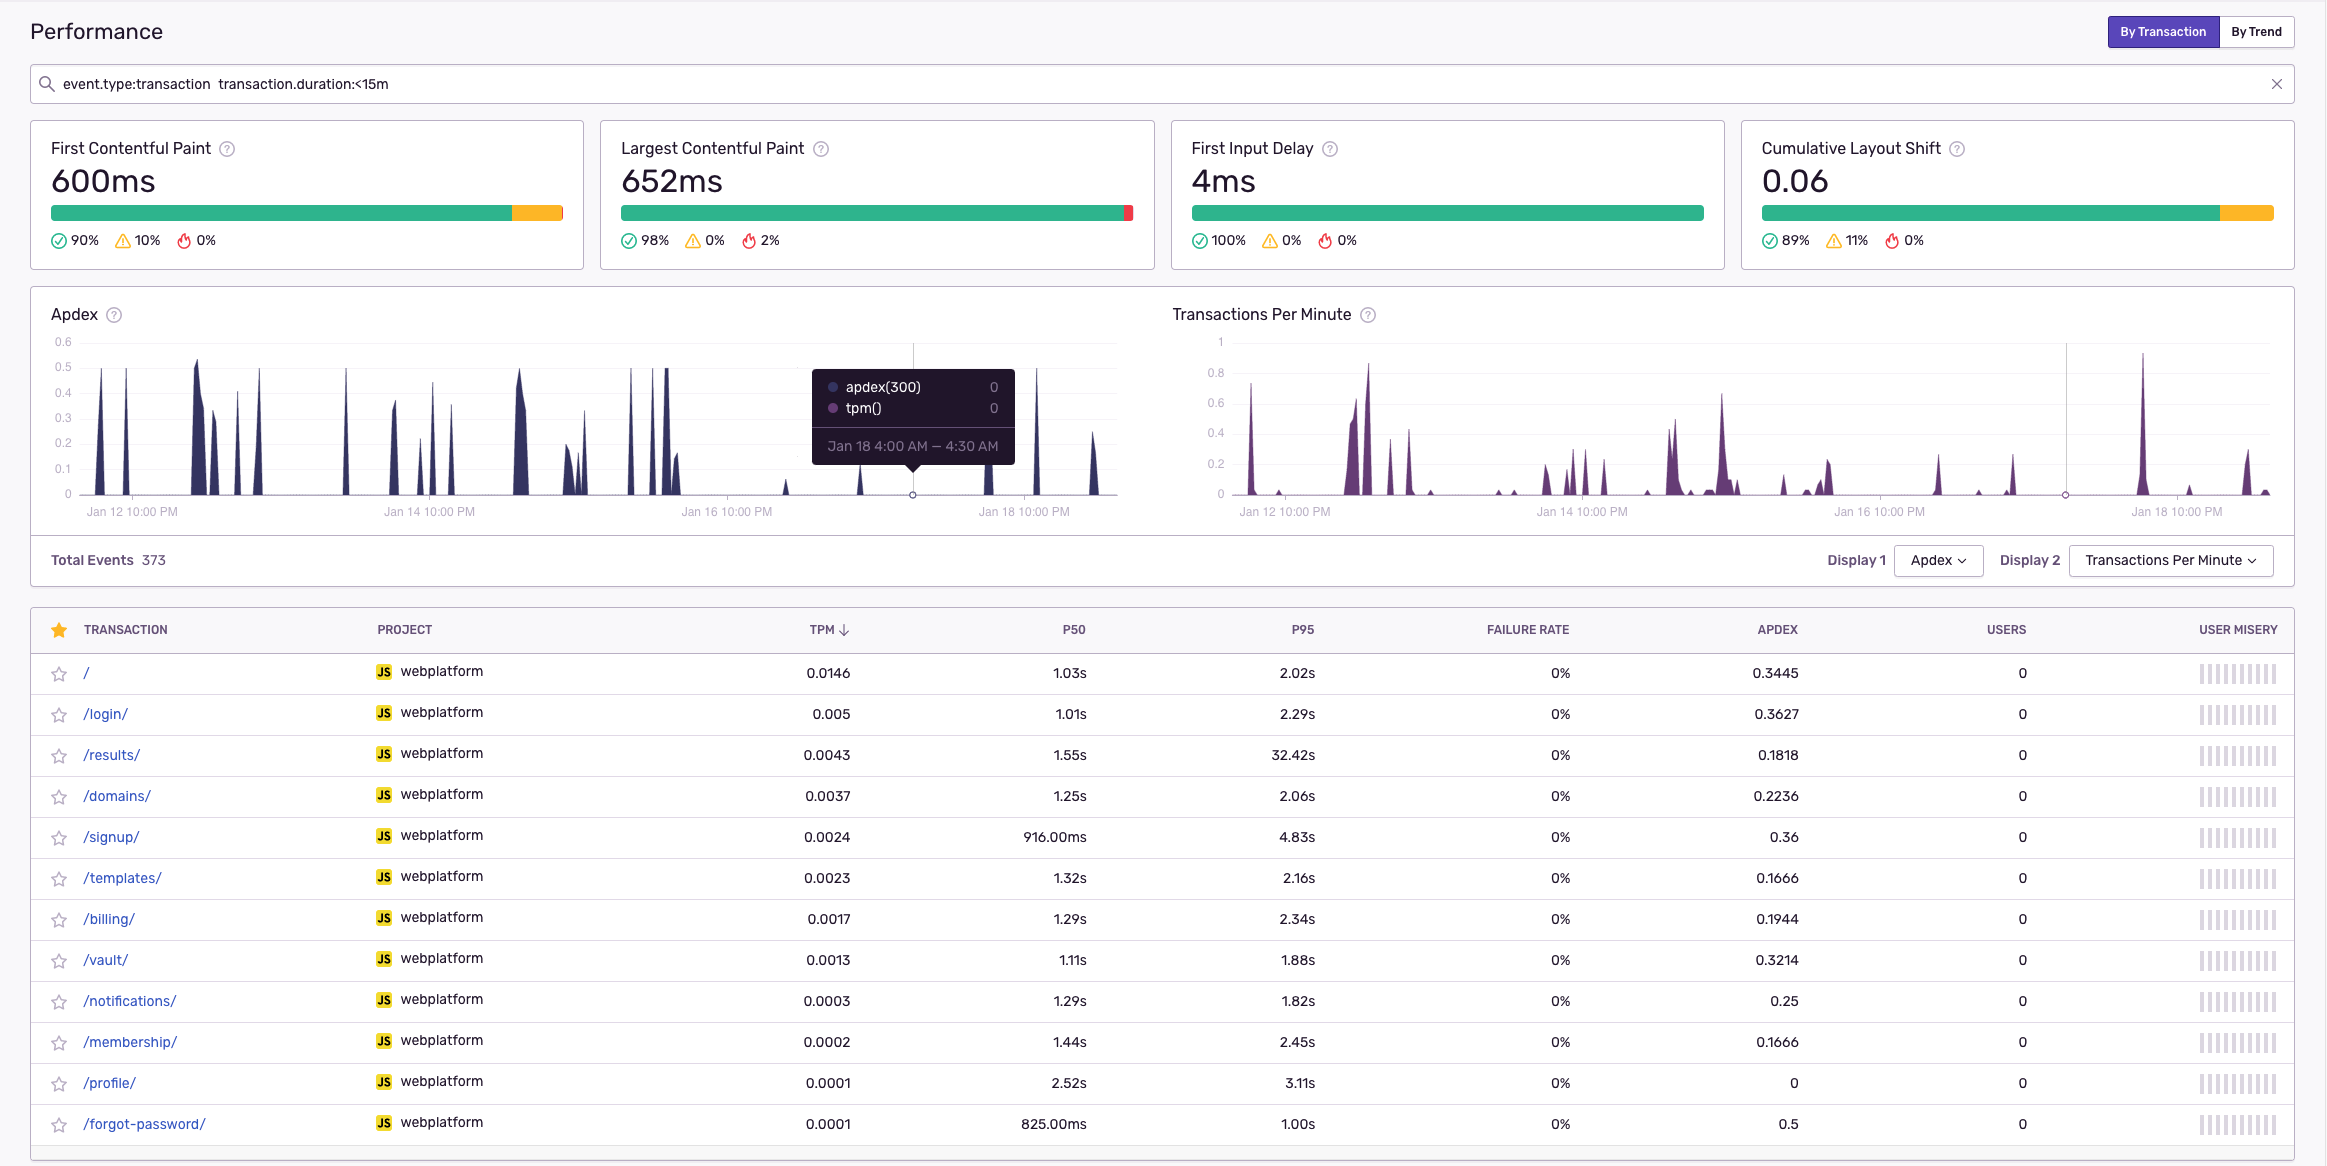
We take great pride in making sure that our platform is as stable and scalable as possible and our monitoring and alerting systems go wild at the tiniest missbehave!
Here's for example our LIVE web platform loading time stats:
Important note about stack
Elastic IP limits
Starting with release 1.4.0 we added High-Availability for NAT Gateways as well. But before you check that, make sure your limits for VPC Elastic IPs can support an extra 3!
You can find the current Applied quote value here -> https://console.aws.amazon.com/servicequotas/home#!/services/ec2/quotas under “EC2-VPC Elastic IPs”.
PS: An increase from 5 to 20 is approved automatically by AWS 😊
Client Ingest DSN record
The Client DSN record that is created by Sentry each and every time you create a new project looks something like this:
https://[email protected].${the_sentry_dns_record}/2
So if the parameter value of SentryDnsRecord is sentry.rungutan.com then the DSN would be:
https://[email protected]/2
Why is this important?
Because you need to make sure that your SSL certificate can handle that specific ingest domain as well
The workaround for this (if it's not possible to use the default ingest record) is to relay on the parameter value that you set up for SentryRelayAlternativeDnsRecord.
This means that if for example the value for SentryRelayAlternativeDnsRecord is sentry-relay.rungutan.com, then you would instead use this specific DSN:
https://[email protected]/2
Also, I cannot stress this enough, but PLEASE, PLEASE, FOR THE LOVE OF ALL THAT IS HOLY, use custom values for these parameters:
- SentrySystemSecretKey
- InitialAdminUserEmail
- InitialAdminUserPassword
Final thoughts
Performance Testing and Performance Monitoring ho hand in hand and none of them must be missing from the toolchain of any good DevOps, Developer or QA.
Choosing the right tooling for your platform is of course difficult, but Rungutan and Sentry have already proven themselves as being production-able and ready for battle!
Don't lose valuable time by guessing why your platform is slow!
Tag summary
Content type
Image
Digest
Size
5.2 MB
Last updated
almost 5 years ago
docker pull rungutancommunity/bash