ryanmaclean/esrally
Elastic's ES Rally Elasticsearch benchmarking tool to be run against a remote ES node/cluster
10K+
ryanmaclean/esrally repository overview
esrally-docker


An Elastic ES Rally Docker container image that allows you to run ESRally in a container and point it at a remote Elasticsearch host/cluster in order to run and re-run benchmarks.
Based on the work found here: https://github.com/honestbee/docker-esrally but much less grandiose in scope, and more automated.
It does a good job of punishing smaller clusters, here's a sample from the Elastic Cloud trial cluster:
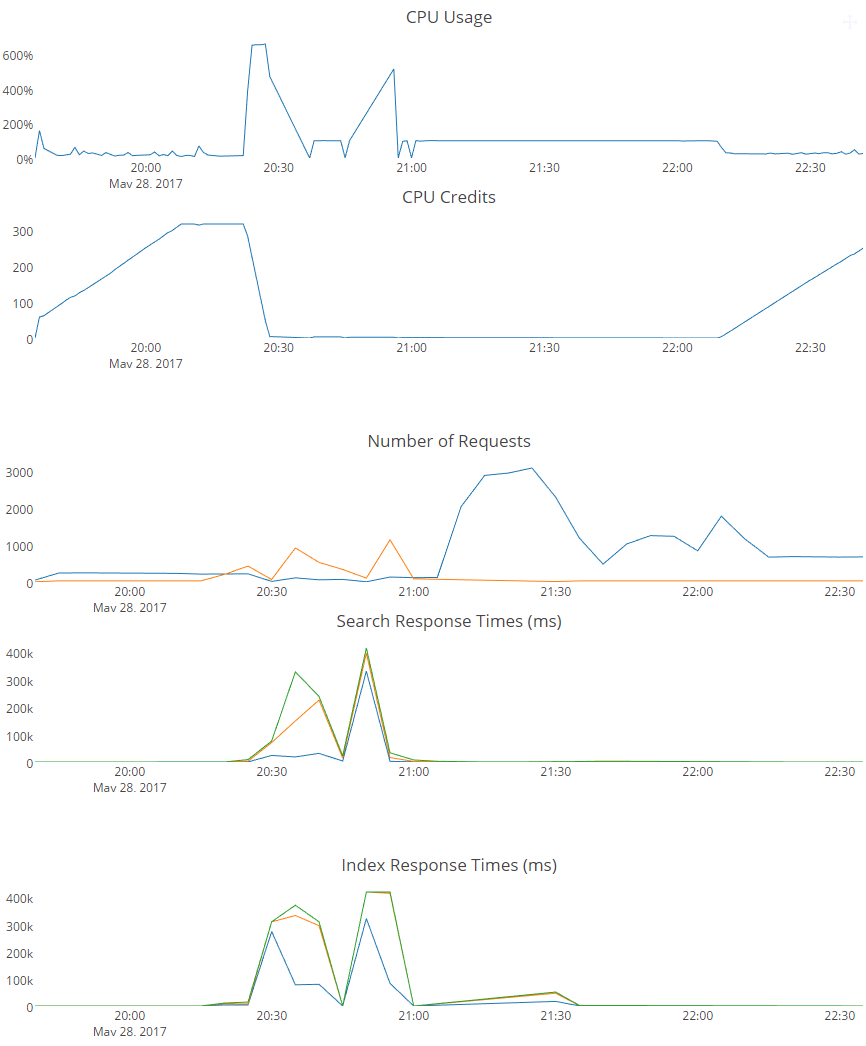
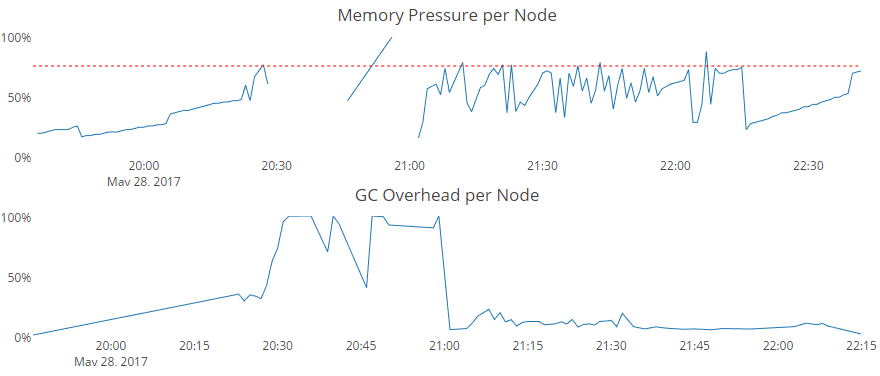
ES Rally in Docker
This docker container is expected to be used as a remote target benchmark.
Warning: it will download a 250MB+ file and expand it to 3.30GB. It will ingest this data into the Elasticsearch cluster that you point it at.
As the disclaimer will warn you:
************************************************************************
************** WARNING: A dark dungeon lies ahead of you  **************
************************************************************************
More Info About ES Rally
This project came about after watching the fantastic ES Rally intro video from Daniel Mitterdorfer: https://www.youtube.com/watch?v=HriBY2zoChw
The ES Rally docs can be found here: http://esrally.readthedocs.io/en/latest/
Usage
There's are three ENV variables, one PIPELINE, which defaults to --pipeline=benchmark-only, an ENDPOINT var that defaults to 192.168.99.100:9200 for Kitematic use, but you can over-ride it as follows:
docker run -it -e ENDPOINT="54.32.263.2:9200" ryanmaclean/esrally:latest
Another is CREDENTIALS, and is left blank, but may be needed when testing X-Pack-enabled clusters. That can be done as follows:
docker run -it -e CREDENTIALS=--client-options="basic_auth_user:'user',basic_auth_password:'password'" ryanmaclean/esrally:latest
This assumes that 54.32.263.2 is the primary endpoint of your cluster, and that you're using 9200 as the Elasticsearch port.
Usage with Elastic Cloud
Elastic Cloud has a remote server connection and security as well as certs enabled, so our string gets a bit long. On top of this, if you're using the trial, the budget allocated for two weeks means that the cluster will be yellow, requiring an final third CLUSTERHEALTH Docker ENV var that translates to an esrally parameter which will allow the test to continue.
For example:
docker run -it \
   - e CREDENTIALS=\
      --client-options=\
         use_ssl:true,\
         verify_certs:true,\
         basic_auth_user:'elastic',\
         basic_auth_password:'lkjsadioioasdlkjas822'
   -e ENDPOINT=\
      0983209823883892039265cd8046e4.us-west-1.aws.found.io:9243
   -e CLUSTERHEALTH=\
      --cluster-health=yellow\
   ryanmaclean/esrally:latest
Sample Output
This is from a terminal session running against the official Elastic Docker container for version 5.4 on a Mid 2015 maxed-out Macbook Pro (not pretty).
It took quite a while to run, and you can see that the boot2docker host should have been tweaked beforehand, but this should be a good baseline of a badly tuned cluster.
    ____        ____
   / __ \____ _/ / /_  __
  / /_/ / __ `/ / / / / /
 / _, _/ /_/ / / / /_/ /
/_/ |_|\__,_/_/_/\__, /
                /____/

INFO:rally.config:Upgrading configuration from version [6] to [8].
INFO:rally.config:Creating a backup of the current config file at [/root/.rally/rally.ini].
INFO:rally.config:Successfully self-upgraded configuration to version [8]
[INFO] Writing logs to /root/.rally/logs/rally_out_20170527T222757Z.log
Cloning into '/root/.rally/benchmarks/tracks/default'...
remote: Counting objects: 1057, done.
remote: Total 1057 (delta 0), reused 0 (delta 0), pack-reused 1057
Receiving objects: 100% (1057/1057), 755.53 KiB | 1.46 MiB/s, done.
Resolving deltas: 100% (799/799), done.
Checking connectivity... done.

************************************************************************
************** WARNING: A dark dungeon lies ahead of you  **************
************************************************************************

Rally does not have control over the configuration of the benchmarked
Elasticsearch cluster.

Be aware that results may be misleading due to problems with the setup.
Rally is also not able to gather lots of metrics at all (like CPU usage
of the benchmarked cluster) or may even produce misleading metrics (like
the index size).

************************************************************************
****** Use this pipeline only if you are aware of the tradeoffs.  ******
*************************** Watch your step! ***************************
************************************************************************

[INFO] Racing on track [geonames], challenge [append-no-conflicts] and car [external]

[INFO] Downloading data from [http://benchmarks.elasticsearch.org.s3.amazonaws.com/corpora/geonames/documents-2.json.bz2] (252 MB) to [/root/.rally/benchmarks/data/geonames/documents-2.json.bz2] ... [OK]
[INFO] Decompressing track data from [/root/.rally/benchmarks/data/geonames/documents-2.json.bz2] to [/root/.rally/benchmarks/data/geonames/documents-2.json] (resulting size: 3.30 GB) ... [OK]
[INFO] Preparing file offset table for [/root/.rally/benchmarks/data/geonames/documents-2.json] ... [OK]
Running index-append                                                           [100% done]
Running force-merge                                                            [100% done]
Running index-stats                                                            [100% done]
Running node-stats                                                             [100% done]
Running default                                                                [100% done]
Running term                                                                   [100% done]
Running phrase                                                                 [100% done]
Running country_agg_uncached                                                   [100% done]
Running country_agg_cached                                                     [100% done]
Running scroll                                                                 [100% done]
Running expression                                                             [100% done]
Running painless_static                                                        [100% done]
Running painless_dynamic                                                       [100% done]
Running large_terms                                                            [100% done]
Running large_filtered_terms                                                   [100% done]
Running large_prohibited_terms                                                 [100% done]

------------------------------------------------------
    _______             __   _____
   / ____(_)___  ____ _/ /  / ___/_________  ________
  / /_  / / __ \/ __ `/ /   \__ \/ ___/ __ \/ ___/ _ \
 / __/ / / / / / /_/ / /   ___/ / /__/ /_/ / /  /  __/
/_/   /_/_/ /_/\__,_/_/   /____/\___/\____/_/   \___/
------------------------------------------------------
| Lap | Metric | Operation | Value | Unit |
|---|---|---|---|---|
| All | Indexing time | 41.7569 | min | |
| All | Merge time | 39.541 | min | |
| All | Refresh time | 15.867 | min | |
| All | Flush time | 0.0291167 | min | |
| All | Merge throttle time | 0.995683 | min | |
| All | Total Young Gen GC | 525.372 | s | |
| All | Total Old Gen GC | 12.543 | s | |
| All | Heap used for segments | 17.9723 | MB | |
| All | Heap used for doc values | 0.11013 | MB | |
| All | Heap used for terms | 16.7452 | MB | |
| All | Heap used for norms | 0.0749512 | MB | |
| All | Heap used for points | 0.213588 | MB | |
| All | Heap used for stored fields | 0.828438 | MB | |
| All | Segment count | 102 | ||
| All | Min Throughput | index-append | 4045.99 | docs/s |
| All | Median Throughput | index-append | 4200.45 | docs/s |
| All | Max Throughput | index-append | 4817.98 | docs/s |
| All | 50.0th percentile latency | index-append | 8832.61 | ms |
| All | 90.0th percentile latency | index-append | 13494.6 | ms |
| All | 99.0th percentile latency | index-append | 19720.5 | ms |
| All | 99.9th percentile latency | index-append | 22807 | ms |
| All | 100th percentile latency | index-append | 23539.8 | ms |
| All | 50.0th percentile service time | index-append | 8832.61 | ms |
| All | 90.0th percentile service time | index-append | 13494.6 | ms |
| All | 99.0th percentile service time | index-append | 19720.5 | ms |
| All | 99.9th percentile service time | index-append | 22807 | ms |
| All | 100th percentile service time | index-append | 23539.8 | ms |
| All | error rate | index-append | 0 | % |
| All | Min Throughput | force-merge | 3.30106 | ops/s |
| All | Median Throughput | force-merge | 3.30106 | ops/s |
| All | Max Throughput | force-merge | 3.30106 | ops/s |
| All | 100th percentile latency | force-merge | 302.75 | ms |
| All | 100th percentile service time | force-merge | 302.75 | ms |
| All | error rate | force-merge | 0 | % |
| All | Min Throughput | index-stats | 99.9312 | ops/s |
| All | Median Throughput | index-stats | 100.049 | ops/s |
| All | Max Throughput | index-stats | 100.093 | ops/s |
| All | 50.0th percentile latency | index-stats | 4.56831 | ms |
| All | 90.0th percentile latency | index-stats | 5.37362 | ms |
| All | 99.0th percentile latency | index-stats | 10.4568 | ms |
| All | 99.9th percentile latency | index-stats | 16.8071 | ms |
| All | 100th percentile latency | index-stats | 20.6186 | ms |
| All | 50.0th percentile service time | index-stats | 4.2707 | ms |
| All | 90.0th percentile service time | index-stats | 4.89174 | ms |
| All | 99.0th percentile service time | index-stats | 9.63112 | ms |
| All | 99.9th percentile service time | index-stats | 16.1339 | ms |
| All | 100th percentile service time | index-stats | 20.4829 | ms |
| All | error rate | index-stats | 0 | % |
| All | Min Throughput | node-stats | 99.7653 | ops/s |
| All | Median Throughput | node-stats | 100.085 | ops/s |
| All | Max Throughput | node-stats | 100.535 | ops/s |
| All | 50.0th percentile latency | node-stats | 4.55892 | ms |
| All | 90.0th percentile latency | node-stats | 6.2264 | ms |
| All | 99.0th percentile latency | node-stats | 85.0515 | ms |
| All | 99.9th percentile latency | node-stats | 153.335 | ms |
| All | 100th percentile latency | node-stats | 159.538 | ms |
| All | 50.0th percentile service time | node-stats | 4.22034 | ms |
| All | 90.0th percentile service time | node-stats | 5.08135 | ms |
| All | 99.0th percentile service time | node-stats | 10.5145 | ms |
| All | 99.9th percentile service time | node-stats | 31.6439 | ms |
| All | 100th percentile service time | node-stats | 159.403 | ms |
| All | error rate | node-stats | 0 | % |
| All | Min Throughput | default | 35.7368 | ops/s |
| All | Median Throughput | default | 38.1349 | ops/s |
| All | Max Throughput | default | 38.7257 | ops/s |
| All | 50.0th percentile latency | default | 6194.75 | ms |
| All | 90.0th percentile latency | default | 8757.89 | ms |
| All | 99.0th percentile latency | default | 9139.22 | ms |
| All | 99.9th percentile latency | default | 9168.4 | ms |
| All | 100th percentile latency | default | 9176.96 | ms |
| All | 50.0th percentile service time | default | 23.1244 | ms |
| All | 90.0th percentile service time | default | 32.4216 | ms |
| All | 99.0th percentile service time | default | 42.7273 | ms |
| All | 99.9th percentile service time | default | 47.2948 | ms |
| All | 100th percentile service time | default | 47.3488 | ms |
| All | error rate | default | 0 | % |
| All | Min Throughput | term | 199.627 | ops/s |
| All | Median Throughput | term | 199.953 | ops/s |
| All | Max Throughput | term | 200.106 | ops/s |
| All | 50.0th percentile latency | term | 3.45829 | ms |
| All | 90.0th percentile latency | term | 9.61196 | ms |
| All | 99.0th percentile latency | term | 25.0415 | ms |
| All | 99.9th percentile latency | term | 30.6498 | ms |
| All | 100th percentile latency | term | 31.8718 | ms |
| All | 50.0th percentile service time | term | 2.67088 | ms |
| All | 90.0th percentile service time | term | 3.56639 | ms |
| All | 99.0th percentile service time | term | 17.2176 | ms |
| All | 99.9th percentile service time | term | 24.8637 | ms |
| All | 100th percentile service time | term | 26.781 | ms |
| All | error rate | term | 0 | % |
| All | Min Throughput | phrase | 181.584 | ops/s |
| All | Median Throughput | phrase | 193.872 | ops/s |
| All | Max Throughput | phrase | 199.885 | ops/s |
| All | 50.0th percentile latency | phrase | 165.916 | ms |
| All | 90.0th percentile latency | phrase | 272.091 | ms |
| All | 99.0th percentile latency | phrase | 293.071 | ms |
| All | 99.9th percentile latency | phrase | 297.487 | ms |
| All | 100th percentile latency | phrase | 299.297 | ms |
| All | 50.0th percentile service time | phrase | 3.25947 | ms |
| All | 90.0th percentile service time | phrase | 7.3253 | ms |
| All | 99.0th percentile service time | phrase | 25.5142 | ms |
| All | 99.9th percentile service time | phrase | 32.5812 | ms |
| All | 100th percentile service time | phrase | 36.5469 | ms |
| All | error rate | phrase | 0 | % |
| All | Min Throughput | country_agg_uncached | 1.10785 | ops/s |
| All | Median Throughput | country_agg_uncached | 1.24299 | ops/s |
| All | Max Throughput | country_agg_uncached | 1.29339 | ops/s |
| All | 50.0th percentile latency | country_agg_uncached | 605116 | ms |
| All | 90.0th percentile latency | country_agg_uncached | 805617 | ms |
| All | 99.0th percentile latency | country_agg_uncached | 854591 | ms |
| All | 99.9th percentile latency | country_agg_uncached | 859400 | ms |
| All | 100th percentile latency | country_agg_uncached | 859942 | ms |
| All | 50.0th percentile service time | country_agg_uncached | 703.377 | ms |
| All | 90.0th percentile service time | country_agg_uncached | 741.63 | ms |
| All | 99.0th percentile service time | country_agg_uncached | 800.875 | ms |
| All | 99.9th percentile service time | country_agg_uncached | 870.371 | ms |
| All | 100th percentile service time | country_agg_uncached | 894.24 | ms |
| All | error rate | country_agg_uncached | 0 | % |
| All | Min Throughput | country_agg_cached | 100.026 | ops/s |
| All | Median Throughput | country_agg_cached | 100.063 | ops/s |
| All | Max Throughput | country_agg_cached | 100.141 | ops/s |
| All | 50.0th percentile latency | country_agg_cached | 3.57384 | ms |
| All | 90.0th percentile latency | country_agg_cached | 4.93876 | ms |
| All | 99.0th percentile latency | country_agg_cached | 16.0598 | ms |
| All | 99.9th percentile latency | country_agg_cached | 22.5004 | ms |
| All | 100th percentile latency | country_agg_cached | 26.4915 | ms |
| All | 50.0th percentile service time | country_agg_cached | 3.15232 | ms |
| All | 90.0th percentile service time | country_agg_cached | 4.06166 | ms |
| All | 99.0th percentile service time | country_agg_cached | 15.8608 | ms |
| All | 99.9th percentile service time | country_agg_cached | 22.1849 | ms |
| All | 100th percentile service time | country_agg_cached | 26.2606 | ms |
| All | error rate | country_agg_cached | 0 | % |
| All | Min Throughput | scroll | 39.7068 | ops/s |
| All | Median Throughput | scroll | 40.5957 | ops/s |
| All | Max Throughput | scroll | 41.0411 | ops/s |
| All | 50.0th percentile latency | scroll | 259404 | ms |
| All | 90.0th percentile latency | scroll | 371192 | ms |
| All | 99.0th percentile latency | scroll | 395720 | ms |
| All | 100th percentile latency | scroll | 398442 | ms |
| All | 50.0th percentile service time | scroll | 598.62 | ms |
| All | 90.0th percentile service time | scroll | 625.847 | ms |
| All | 99.0th percentile service time | scroll | 651.197 | ms |
| All | 100th percentile service time | scroll | 658.699 | ms |
| All | error rate | scroll | 0 | % |
| All | Min Throughput | expression | 0.67594 | ops/s |
| All | Median Throughput | expression | 0.678439 | ops/s |
| All | Max Throughput | expression | 0.680025 | ops/s |
| All | 50.0th percentile latency | expression | 293177 | ms |
| All | 90.0th percentile latency | expression | 369571 | ms |
| All | 99.0th percentile latency | expression | 386814 | ms |
| All | 100th percentile latency | expression | 388714 | ms |
| All | 50.0th percentile service time | expression | 1459.99 | ms |
| All | 90.0th percentile service time | expression | 1492.65 | ms |
| All | 99.0th percentile service time | expression | 1522.07 | ms |
| All | 100th percentile service time | expression | 1527.01 | ms |
| All | error rate | expression | 0 | % |
| All | Min Throughput | painless_static | 0.495775 | ops/s |
| All | Median Throughput | painless_static | 0.514832 | ops/s |
| All | Max Throughput | painless_static | 0.519771 | ops/s |
| All | 50.0th percentile latency | painless_static | 433935 | ms |
| All | 90.0th percentile latency | painless_static | 570563 | ms |
| All | 99.0th percentile latency | painless_static | 603637 | ms |
| All | 100th percentile latency | painless_static | 607317 | ms |
| All | 50.0th percentile service time | painless_static | 2003.61 | ms |
| All | 90.0th percentile service time | painless_static | 2512.4 | ms |
| All | 99.0th percentile service time | painless_static | 2795.82 | ms |
| All | 100th percentile service time | painless_static | 2993.33 | ms |
| All | error rate | painless_static | 0 | % |
| All | Min Throughput | painless_dynamic | 0.463116 | ops/s |
| All | Median Throughput | painless_dynamic | 0.471679 | ops/s |
| All | Max Throughput | painless_dynamic | 0.488911 | ops/s |
| All | 50.0th percentile latency | painless_dynamic | 487720 | ms |
| All | 90.0th percentile latency | painless_dynamic | 629961 | ms |
| All | 99.0th percentile latency | painless_dynamic | 657571 | ms |
| All | 100th percentile latency | painless_dynamic | 660803 | ms |
| All | 50.0th percentile service time | painless_dynamic | 2132.71 | ms |
| All | 90.0th percentile service time | painless_dynamic | 2692.83 | ms |
| All | 99.0th percentile service time | painless_dynamic | 3210.24 | ms |
| All | 100th percentile service time | painless_dynamic | 3589.56 | ms |
| All | error rate | painless_dynamic | 0 | % |
| All | Min Throughput | large_terms | ops/s | |
| All | Median Throughput | large_terms | ops/s | |
| All | Max Throughput | large_terms | ops/s | |
| All | 50.0th percentile latency | large_terms | 203.65 | ms |
| All | 90.0th percentile latency | large_terms | 368.147 | ms |
| All | 99.0th percentile latency | large_terms | 567.241 | ms |
| All | 100th percentile latency | large_terms | 906.133 | ms |
| All | 50.0th percentile service time | large_terms | 201.502 | ms |
| All | 90.0th percentile service time | large_terms | 362.732 | ms |
| All | 99.0th percentile service time | large_terms | 517.201 | ms |
| All | 100th percentile service time | large_terms | 905.241 | ms |
| All | error rate | large_terms | 100 | % |
| All | Min Throughput | large_filtered_terms | 0.461976 | op |
Tag summary
Content type
Image
Digest
Size
145.6 MB
Last updated
over 8 years ago
docker pull ryanmaclean/esrally