scottibyte/incus-dashboard
Incus Dashboard provides high level observation for container resource usage across multiple servers
526
scottibyte/incus-dashboard repository overview
ScottiBYTE Incus Dashboard
The ScottiBYTE Incus Dashboard allows administrators to monitor Incus infrastructure from a single lightweight web interface using the native Incus client and remote trust relationships.
Dashboard Overview
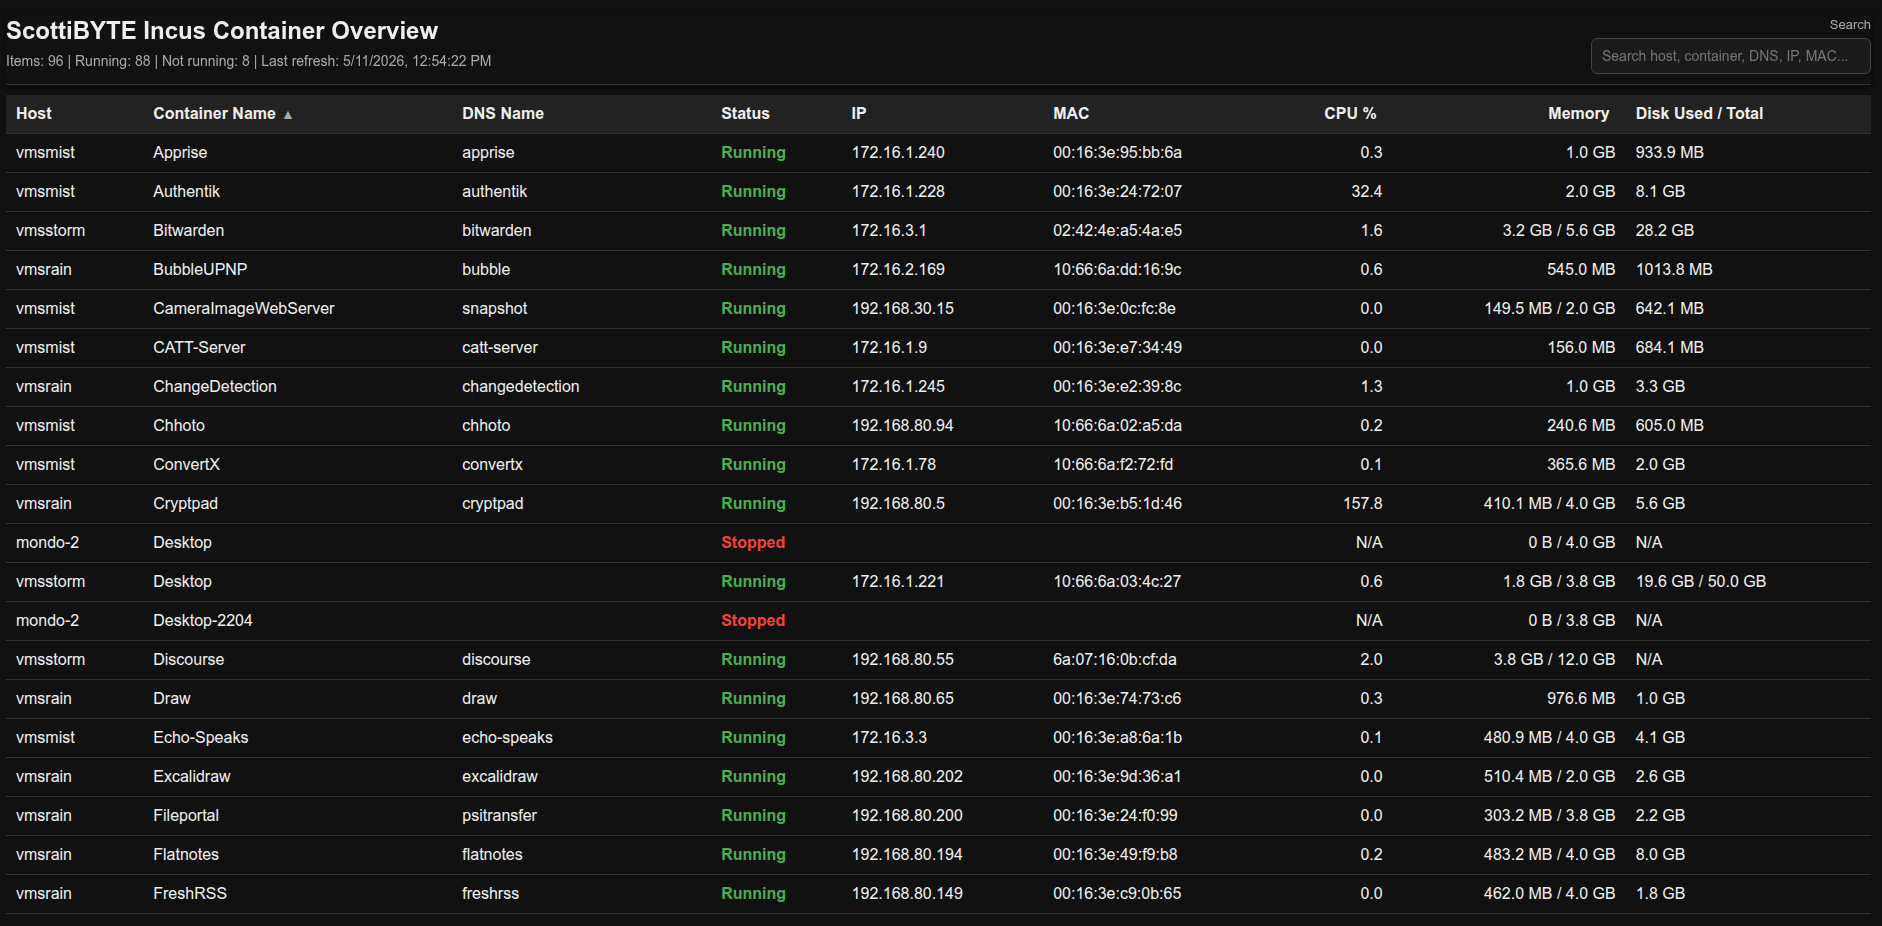
Features
- Multi-server Incus monitoring
- Real-time container visibility
- Unified dashboard across Incus hosts
- Lightweight Docker deployment
- Native Incus client integration
- Secure trust-token authentication
- Read-only infrastructure visibility
- Simple Docker Compose deployment
- Centralized container management visibility
- No database required
1. Install the Incus Client
Run this on the system where Docker will run:
sudo apt update
sudo apt install incus-client -y
Verify the Incus client is installed:
incus remote list
2. Add Remote Incus Servers
Repeat this process for every Incus server you want the dashboard to monitor.
In this example, the Incus server is named vmsmist.
First, create a trust token from the Docker host:
ssh vmsmist "incus config trust add Incus-Dashboard"
Copy the token that is returned.
Now add the remote Incus server:
incus remote add vmsmist https://vmsmist:8443 --accept-certificate
Paste the trust token when prompted.
Verify that the remote works:
incus list vmsmist:
Repeat the same process for each additional Incus server:
ssh vmsstorm "incus config trust add Incus-Dashboard"
incus remote add vmsstorm https://vmsstorm:8443 --accept-certificate
incus list vmsstorm:

ssh vmsrain "incus config trust add Incus-Dashboard"
incus remote add vmsrain https://vmsrain:8443 --accept-certificate
incus list vmsrain:

ssh mondo-2 "incus config trust add Incus-Dashboard"
incus remote add mondo-2 https://mondo-2:8443 --accept-certificate
incus list mondo-2:
3. Deploy the Dashboard
Create a directory for the dashboard:
mkdir incus-dashboard
cd incus-dashboard
Create the Docker Compose file:
nano docker-compose.yml
Paste this into docker-compose.yml:
services:
  incus-dashboard:
    image: scottibyte/incus-dashboard:latest
    container_name: incus-dashboard
    restart: unless-stopped
    ports:
      - "80:80"
    volumes:
      - /home/YOUR_USER/.config/incus:/root/.config/incus:ro
Replace YOUR_USER with your Linux username.
Example:
services:
  incus-dashboard:
    image: scottibyte/incus-dashboard:latest
    container_name: incus-dashboard
    restart: unless-stopped
    ports:
      - "80:80"
    volumes:
      - /home/scott/.config/incus:/root/.config/incus:ro
Start the dashboard:
docker compose up -d
Verify it is running:
docker ps
docker compose logs
You should see:
Dashboard running on port 80
4. Open the Dashboard
Open a browser and go to:
http://YOUR-SERVER-IP
5. Update the Dashboard
From the incus-dashboard directory:
docker compose pull
docker compose up -d
6. Troubleshooting
If the dashboard opens but no containers are shown, test the Incus remotes from the Docker host:
incus remote list
incus list vmsmist:
If incus list remote-name: does not return containers, fix the Incus remote connection before troubleshooting Docker.
If port 80 is already in use, check what is using it:
sudo ss -ltnp | grep ':80'
If you change the left side of the port mapping, for example:
ports:
  - "8080:80"
then open:
http://YOUR-SERVER-IP:8080
Version 1.1 Enhancements
Version 1.1 introduces major usability and visual improvements to the dashboard interface including:
-
Alternating row highlighting for improved readability
-
Interactive status and summary indicators
-
Enhanced sticky headers
-
Click-to-copy support for:
- Container names
- IP addresses
- MAC addresses
-
Row selection highlighting
-
CPU and memory utilization color indicators
-
Improved stopped-container visibility
-
Responsive UI refinements
-
Modernized observability-style dashboard appearance
The dashboard remains intentionally lightweight while providing a centralized operational view across distributed Incus infrastructure.
Security Notes
- The dashboard uses the native Incus client and trusted remote relationships
- No privileged Docker mode is required
- No database is used or stored
- Remote authentication is handled through standard Incus trust certificates
- The mounted Incus configuration is read-only inside the container
Future Development
Planned future enhancements may include:
- Container start/stop controls
- Resource graphs and historical metrics
- Host health indicators
- Snapshot visibility
- Storage pool visibility
- VM support enhancements
- Search and filtering improvements
- Mobile dashboard optimizations
Community Support
Need help with Incus Dashboard, Docker deployment, Incus profile management, container creation, or ScottiBYTE utilities?
Join the ScottiBYTE Rocket.Chat community:
New users can start in #general. From there, you can find other ScottiBYTE project channels and community discussions.
For bugs and feature requests, please continue to use GitHub Issues. For quick questions and community discussion, use Rocket.Chat.
Tag summary
Content type
Image
Digest
sha256:b8ff16ead…
Size
71.6 MB
Last updated
4 months ago
docker pull scottibyte/incus-dashboard