usernamedigital/pi-dashboard
Raspberry Pi monitoring dashboard: live metrics, history, Docker, REST API and MCP server
9.6K
usernamedigital/pi-dashboard repository overview
Pi Dashboard
Source, issues and changelog: https://github.com/zepgram/pi-dashboard
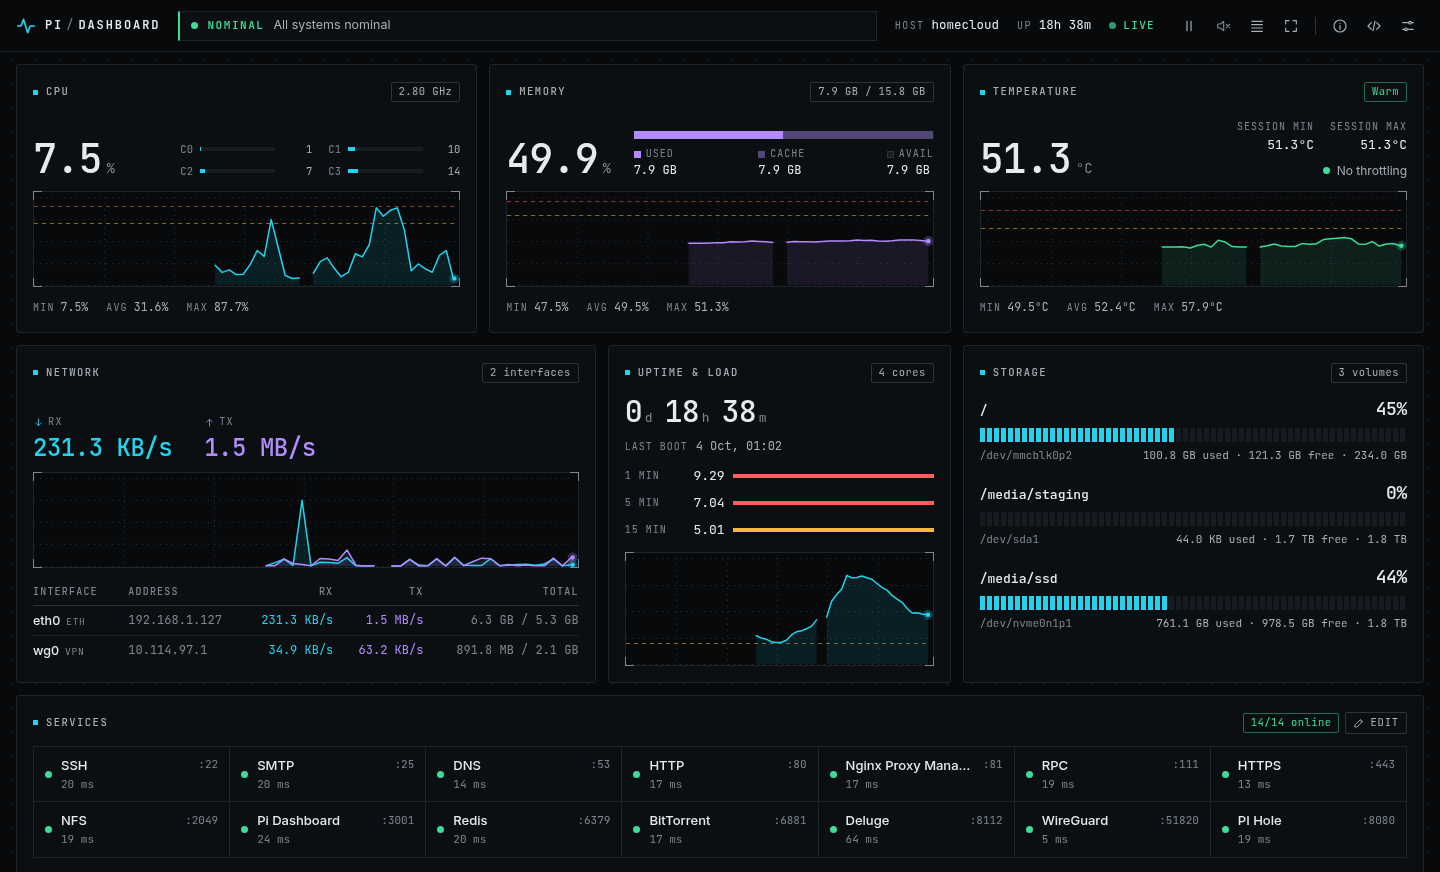
Real-time monitoring dashboard for a Raspberry Pi home server (or any Linux box): one container, no database, a REST API and a built-in MCP server.





Features
- Live metrics: CPU (per core, frequency, overclock), memory, temperature, load, disks, network rates, top processes.
- History: the last hour and the last 24 hours of CPU, memory, temperature, load and network, kept in memory and carried across restarts.
- Raspberry Pi specifics: under-voltage and throttling status, session min/max temperature.
- Docker: every container with state, health, CPU and memory, without enabling the memory cgroup.
- Service health: HTTP, HTTPS, TCP, Redis, DNS and network-interface checks, with auto-discovery of what listens on the host.
- WireGuard: connected clients, last handshake, transfer.
- Alerts: configurable warning and critical thresholds, toast and optional sound.
- REST API protected by an API key, and an MCP server so an AI assistant can read the state of the machine.
- Interface: three densities (normal, compact, ultra for kiosks), five colour themes, keyboard shortcuts, installable on a phone. No external request: it works on a network without Internet access.
- Settings are stored server-side and shared by every device.
Quick start (Docker)
The image is built for linux/arm64 and linux/amd64.
mkdir -p pi-dashboard/data && cd pi-dashboard
curl -O https://raw.githubusercontent.com/zepgram/pi-dashboard/main/docker-compose.yml
docker compose up -d
The dashboard is at http://your-pi-ip:3001.
services:
  pi-dashboard:
    image: usernamedigital/pi-dashboard:latest
    container_name: pi-dashboard
    restart: unless-stopped
    environment:
      - PORT=3001
      - SETTINGS_CONFIG=/app/data/settings.json
      - ADMIN_TOKEN=           # optional: protects configuration changes
      - CORS_ORIGINS=*
    volumes:
      - ./data:/app/data                               # settings, API key hash, history
      - /proc:/host/proc:ro                            # host metrics
      - /sys:/host/sys:ro
      - /:/host/root:ro                                # disks, OS release, pending updates
      - /var/run/docker.sock:/var/run/docker.sock:ro   # containers
      - /etc/wireguard:/etc/wireguard:ro               # WireGuard client names (optional)
    pid: host
    network_mode: host
    cap_add:
      - NET_ADMIN                                      # `wg show` (optional)
    # devices:
    #   - /dev/vcio:/dev/vcio                          # full throttling status (optional, Pi only)
| Setting | Why |
|---|---|
pid: host | host processes and per-container memory |
network_mode: host | host interfaces and service checks on localhost |
/proc, /sys, / read-only | CPU, memory, temperature, cgroups, disk usage, OS information |
/var/run/docker.sock | container list and state |
./data | settings, API key hash and history survive restarts and upgrades |
/dev/vcio | lets vcgencmd report frequency capping and thermal throttling; without it only live under-voltage is detected |
Tags
| Tag | Content |
|---|---|
latest | latest release |
2.0.0, 2.0, 2 | a release, its minor line, its major line |
Upgrading from 1.x
Pull and restart: docker compose pull && docker compose up -d. The compose file, the
environment variables, settings.json and the API are unchanged. See
CHANGELOG.md for what is new and what was fixed.
URL parameters
Handy for a kiosk or a wall display; they apply to that browser only.
| Parameter | Values |
|---|---|
mode | normal, compact, ultra |
theme | default, emerald, rose, amber, indigo |
modal | settings, api, sysinfo, services, help, chart |
chart, range | with modal=chart: cpu, memory, temperature, network, load and live, 1h, 24h |
Example: http://your-pi:3001/?mode=ultra&theme=emerald. Press ? in the dashboard for the
keyboard shortcuts.
Running from source
Requires Node.js 22 or newer.
git clone https://github.com/zepgram/pi-dashboard.git
cd pi-dashboard
npm install
npm run dev        # API on :3001, Vite dev server on :5173
npm test           # unit and API tests
npm run build      # production frontend in dist/
npm start          # serves the API and dist/ on :3001
docker compose up -d --build   # build the image locally (uncomment `build: .`)
Configuration
Everything lives in settings.json (SETTINGS_CONFIG). It is written by the interface and
can be edited by hand; changes are picked up without a restart.
{
  "dashboard": {
    "theme": "default",
    "interval": 1,
    "sound": true,
    "thresholds": {
      "cpu": { "warning": 70, "critical": 90 },
      "memory": { "warning": 80, "critical": 95 },
      "temperature": { "warning": 65, "critical": 80 },
      "disk": { "warning": 80, "critical": 95 }
    }
  },
  "api": { "enabled": false, "keyHash": null },
  "wireguard": { "enabled": false, "interface": "wg0" },
  "services": [
    { "name": "Pi-hole", "port": 80, "path": "/admin/", "host": "localhost", "checkType": "http", "icon": "shield", "enabled": true }
  ]
}
| Service field | Description | Default |
|---|---|---|
name | display name | required |
port | port to check | required |
checkType | http, https, tcp, redis, dns or interface | inferred from the port |
path | path requested by HTTP checks | / |
host | host to check | localhost |
interface | interface name for interface checks (wg0, tun0...) | from the port |
enabled | checked and shown | true |
An HTTP check is online for any answer below 500 (a login page or a 403 means the service
is up). TLS certificates are not verified.
Environment variables
| Variable | Description | Default |
|---|---|---|
PORT | listening port | 3001 |
SETTINGS_CONFIG | path of the settings file | ./settings.json |
ADMIN_TOKEN | when set, every configuration change needs the X-Admin-Token header | (empty: no auth) |
CORS_ORIGINS | allowed origins, comma-separated | * in the image |
Without ADMIN_TOKEN, anyone who can reach the port can change the settings. That is fine
on a home network; set a token, or put a reverse proxy with authentication in front, before
exposing the dashboard anywhere else.
API
Dashboard API
| Endpoint | Method | Description |
|---|---|---|
/api/stats | GET | current metrics: CPU, memory, temperature, load, disks, containers, network, processes |
/api/history?range=1h|24h | GET | metric history (see below) |
/api/sysinfo | GET | hardware and OS identity |
/api/services | GET | health of the enabled services |
/api/services/config | GET, PUT, POST | read, replace, add services |
/api/services/config/:index | DELETE | remove a service |
/api/services/discover | GET | services found listening on the host |
/api/settings | GET, PUT | dashboard preferences |
/api/settings/api | GET, PUT | external API switch and key |
/api/settings/wireguard | GET, PUT | WireGuard monitoring |
/api/wireguard | GET | WireGuard clients |
/api/health | GET | liveness and version |
PUT, POST and DELETE need X-Admin-Token when ADMIN_TOKEN is set.
History format: step seconds between points (5 for 1h, 60 for 24h), point i is at
from + i * step * 1000 (milliseconds), null where nothing was recorded.
{
  "range": "1h",
  "step": 5,
  "from": 1791130290000,
  "to": 1791133885000,
  "series": { "cpu": [12.4, null], "memory": [], "temperature": [], "load": [], "rx": [], "tx": [] }
}
cpu and memory are percentages, temperature is in °C, load is the 1-minute load
average, rx and tx are bytes per second over the physical interfaces.
External API (v1)
For other applications. Enable it and generate a key from the interface (API button).
| Endpoint | Description |
|---|---|
GET /api/v1/system | everything at once: metrics, hardware, services, WireGuard when enabled |
GET /api/v1/history?range=1h|24h | metric history |
curl -H "X-API-Key: YOUR_KEY" http://your-pi:3001/api/v1/system
curl -H "Authorization: Bearer YOUR_KEY" http://your-pi:3001/api/v1/system
curl "http://your-pi:3001/api/v1/system?key=YOUR_KEY"
Only a SHA-256 hash of the key is stored: the key is displayed once, when generated.
MCP server
The dashboard speaks the Model Context Protocol on
/mcp (Streamable HTTP), so an assistant such as Claude can answer "is my Pi healthy?",
"what is using the CPU?" or "did the temperature spike last night?" from live data.
It is controlled by the same switch and the same key as the external API, and it is read-only: no tool changes anything on the machine.
claude mcp add --transport http pi-dashboard http://your-pi:3001/mcp \
  --header "Authorization: Bearer YOUR_KEY"
For other clients:
{
  "mcpServers": {
    "pi-dashboard": {
      "type": "http",
      "url": "http://your-pi:3001/mcp",
      "headers": { "Authorization": "Bearer YOUR_KEY" }
    }
  }
}
| Tool | Returns |
|---|---|
get_system_overview | CPU, memory, temperature and throttling, load, uptime, disks, network, container and service counts, alerts currently raised |
list_containers | containers with state, health, CPU and memory (filter by state, sort) |
get_services_status | status and latency of every configured health check |
get_top_processes | processes using the most CPU right now |
get_history | min, average, max and a downsampled series of one metric over 1 h or 24 h |
get_wireguard_clients | WireGuard peers, when monitoring is enabled |
get_system_info | board, CPU, memory, OS and kernel |
The endpoint is plain HTTP, like the dashboard. To reach it from outside your network, put it behind a reverse proxy with TLS.
Notes for Raspberry Pi
- Container memory is computed from the processes of each container, so it works on a stock Raspberry Pi OS where the memory cgroup controller is disabled. Container CPU is normalised: 100 % means every core is busy.
- Pending package updates are read with the host's
apt, from the read-only host root. - Top processes show the CPU share over the last sample (100 % = one core), like
top.
Project layout
server/            Express API
  collector/       sampling loop: host metrics, disks, Docker, processes
  history.js       1 h and 24 h ring buffers
  mcp.js           MCP tools
  checks.js        service health checks
  settings.js      settings store and validation
src/               frontend (vanilla JS modules, built with Vite)
test/              node:test suites
License
MIT. See LICENSE.
Tag summary
Content type
Image
Digest
sha256:ad5718805…
Size
62.6 MB
Last updated
12 days ago
docker pull usernamedigital/pi-dashboard