utsw1qbrc/cytof-image repository overview
CyTOF Image Analysis
A python-based CyTOF image analysis package.Overview
CyTOF (Cytometry by time-of-flight) mass cytometry uses a time-of-flight ICP-MS (Inductively Coupled Plasma Mass Spectrometry) instrument that can detect dozens of protein markers (up to 40) simultaneously. CyTOF mass cytometry is used to quantify labeled targets on the surface and interior of single cells by measuring the abundance of rare earth metal isotopes tagged to antibodies. Analyzing metal abundances enables the determination of marker expression in individual cells.The IMC (Imaging Mass Cytometry) technology has been pioneered by Standard BioTools Inc. (previous known as Fluidigm) with their [Hyperion™ Imaging System](https://www.standardbio.com/products-services/instruments/hyperion). The Hyperion Imaging System works as a pixel-level mass cytometry for multiplexed protein profiling.
Typically, data acquired from one scan using the Hyperion™ Imaging System is a whole slide tissue image (WSI) with one or more regions of interest (ROI). The whole slide image is an MCD file that can be viewed with MCD™ Viewer. Each ROI is represented by a TXT file. Alternatively, the ROIs also be saved as generic tiled TIFF format (i.e. TIFF images).
This Python-based CyTOF Image Analysis package enables the analysis of CyTOF images automatically, multiple data sources accepted, without the engagement of MCD Viewer or other external tools.
Main functionalities include preprocessing raw CyTOF data, visualization, nuclei and cells segmentation,
single-cell feature extraction, exploration of individual cell phenotypes, cell-cell interactions, etc.
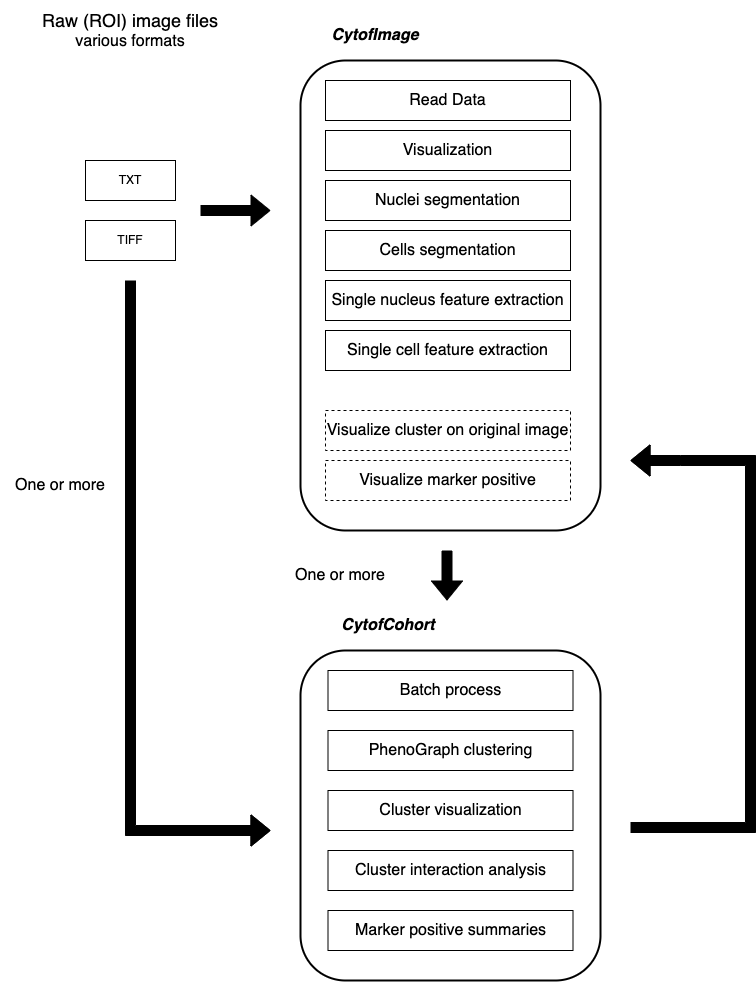
This package can be used as a stand-alone python toolbox, a web-based tool, as well as a CLI.
Getting Started
Detailed analysis instructions
Note
1. If you are using a Windows machine, Git Bash is highly recommended as a command line tool.
2. Direct yourself to this directory, i.e. image_cytof.
Installation
Installation Option 1: clone repo and install from source
- Clone this repo:
- Create a virtual environment with Python3.8:
- Install requirements:
 $ git clone [email protected]:QBRC/deep-learning/development/image_cytof.git
$ cd image_cytof $ conda create -n "image_cytof" python=3.8
$ conda activate image_cytof $ pip install -r requirements.txtInstallation Option 2 (To come)
$ pip install image_cytofStand-alond usage
1. Detailed analysis steps
- Read this for detailed instructions.
- Analyze single ROIs saved as TXT files: refer to this jupyter notebook.
- Analyze single ROIs saved as TIFF files: refer to this jupyter notebook.
2. CLI (Command Line Interface) usage
To use the CLI, input files with specific file content structure need to be prepared.
(1) Single ROI
Check out this sample input file. $ cd .CLIscripts/
$ python single_roi.py path_to_input_fileslideID/
|---roiID/
| |---channel_images/ # png files, single channel images or all channels in one image
| |---cytof_img.pkl
| |---readme.txt # channels and markers information
| |---feature/ # extracted feature (raw, and w/ normalization)
| |---feature_summary.csv
| |---feature_summary_75normed.csv
| |---feature_summary_99normed.csv
| |---downstream analysis/ # downstream analysis
| |---phenograph/ # PhenoGraph clustering related analysis, different parameter sets result in different subfolders
| |---75normed_scaled_all_50_all-9/
| |---cluster_scatter_cohort_cohort.png
| |---protein_expression_cohort_cell_ave_cohort.png
| |---protein_expression_cohort_cell_sum_cohort.png
| |---marker positive/ # Marker positive analysis, different parameter sets result in different subfolders
| |---75normed_sum/
| |---cell_count.csv
| |---marker_pos.csv
| |---cytof_img_cohort.pkl
(2) Cohort
The structure of saved processing output:
cohort/
|---slide1/
|    |---roi1/
|        |---channel_images/          # png files, single channel images or all channels in one image
|        |---cytof_img.pkl
|        |---readme.txt               # channels and markers information
|        |---feature/                 # extracted feature (raw, and w/ normalization)
|              |---feature_summary.csv
|              |---feature_summary_75normed.csv
|              |---feature_summary_99normed.csv
|    |---roi2/
|    |--...
|---slide2/
|    |---roi1/
|        |---channel_images/          # png files, single channel images or all channels in one image
|        |---cytof_img.pkl
|        |---readme.txt               # channels and markers information
|        |---feature/                 # extracted feature (raw, and w/ normalization)
|              |---feature_summary.csv
|              |---feature_summary_75normed.csv
|              |---feature_summary_99normed.csv
|---cytof_cohort.pkl                  # the pickle file of the CytofCohort object
|---downstream analysis/              # downstream analysis
|    |---phenograph/                  # PhenoGraph clustering related analysis, different parameter sets result in different subfolders
|    |---marker/
|---readme.txt # channels and markers informationUse our prebuilt docker image! (New)
Use the Docker desktop
- Make sure you have the docker desktop installed.
- Start the docker desktop.
- Search for "utsw1qbrc/cytof-image" in the search bar and pull the docker image to your local computer. (The docker image can be found here).

- Run the docker image. Remember to set the "Host port" as shown in the screenshot below:

- Direct yourself to the local host for analysis (in the case shown in the example: http://localhost:8000/).
- When you finished, you can access all saved output files
by directing yourself to the "Files" tab, then under the "app" subfolder, find the "output" subfolder.
Command-line usage (details to come)
Try our Flask tool! (New)
- Install (or confirm installation of) Python.
- Create an virtual environment for Flask.
- Install Flask
- Install dependency for
image_cytofpython package(env) $ pip install -r requirements.txt - Run Flask (finally)!
With the
envactivated, typeto run flask.(env) $ flask run
$ python3 -m venv env # Linux or macOS $ python -m venv env # Windowsenv to desired name for the environment.
To activate the environment:
$ . env/bin/activate # Linux or macOS $ env\Scripts\activate # Windows $ . env/Scripts/activate # Windows with Git Bash $ (env) $ deactivate(env) $ pip install flaskPossible failures and troubleshooting
-
failed in
pip install -r requirement.
thenpip install --upgrade pip setuptools wheel --userpip install -r requirement - Python version at least 3.7 to use flask.
- Python3.7 - requirements_p37.txt
- Python3.8 - requirements.txt
- However, using Python3.7 will result in some version related issues. So please use Python3.8.
Tag summary
Content type
Image
Digest
sha256:afd80df94…
Size
2.1 GB
Last updated
over 3 years ago
docker pull utsw1qbrc/cytof-image