utsw1qbrc/hd_wsi repository overview

Histological Based Nuclei Segmentation and Tumor Microenvironment Characterization Pipeline
1. Introduction
This pipeline is designed for image patch and whole slide level nuclei detection, segmentation, and TME feature extraction. The pipeline uses HD-Yolo algorithm by default for real-time nuclei segmentation across the whole slide and utilizes the results for TME feature analysis. There are three main functions/components in this repo. A docker image here contains all the code, model, and test data.
Citation
Rong R, Sheng H, Jin KW, Wu F, Luo D, Wen Z, Tang C, Yang DM, Jia L, Amgad M, Cooper LAD, Xie Y, Zhan X, Wang S, Xiao G. A Deep Learning Approach for Histology-Based Nucleus Segmentation and Tumor Microenvironment Characterization. Mod Pathol. 2023 Apr 24:100196. doi: 10.1016/j.modpat.2023.100196. Epub ahead of print. PMID: 37100227. [Pubmed]
Contact
If you have any questions or suggestions, please contact the following:
Developer: Ruichen Rong ([email protected])
Maintainer: Hudanyun Sheng ([email protected])
Corresponding: Shidan Wang ([email protected])
Corresponding: Xiaowei Zhan ([email protected])
Corresponding: Guanghua Xiao ([email protected])
1.1 Function a: Image patch nuclei segmentation
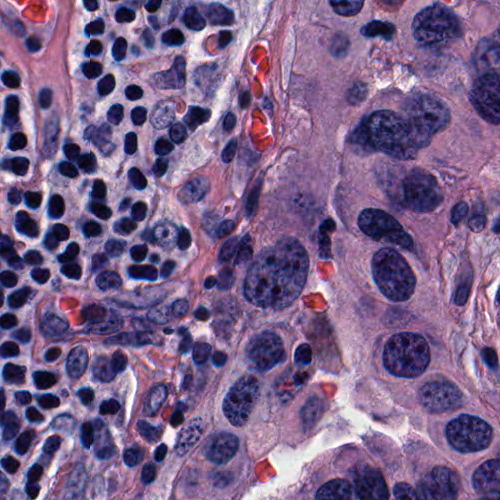
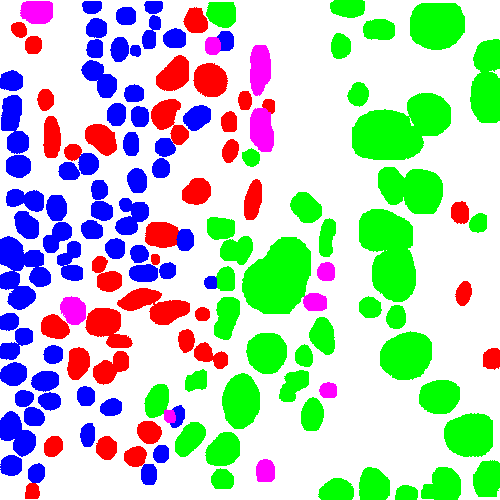
The first component (run_patch_inference.py) runs a pre-trained object detection/segmentation model on image patches and outputs nuclei locations, types, and masks. This process can be done in real time and is integrated into our real-time deepzoom server.
| Sample input patch | Nuclei segmentation |
|---|---|
 |  |
1.2 Function b: Whole slide nuclei detection and segmentation
The second component (run_wsi_inference.py) applies a pre-trained object detection/segmentation model on whole slide images and outputs nuclei locations, types and masks. Results can be viewed through deep zoom server.
| Sample input slide | Nuclei segmentation |
|---|---|
 |  |
1.3 Function c: Nuclei and TME feature extraction
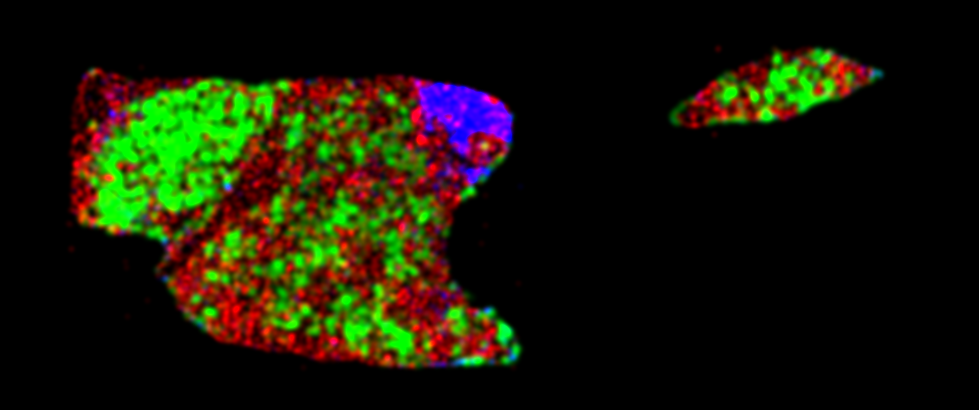
The third component (summarize_tme_features.py) extracts nuclei morphological features and further utilizes a density-based feature extraction module to summarize slide level and ROI level TME features. All nuclei detected above will be allocated into a 2d point cloud and further smoothed into density maps that reflect nuclei distribution. Then multiple Delaunay graph-based and density-based TME features will be calculated.
| Nuclei scatter plot | Nuclei density plot |
|---|---|
 |  |
2. Installation
2.1 Computer / Server Requirements
Whole slide pathology image (WSI) analysis requires the necessary computer hardware settings due to the big size of the pathology image. The type 20X image size might range between 100MB and 600MB. Moreover, the A Nvidia GPU device is recommended to run the WSI analysis on a large dataset (our docker doesn’t support non-Nvidia GPU, such as intel integrated GPU or ATI GPU). Lastly, Function (a) and Function (b/c) has different hardware requirements due to the input file size). By default, this docker image is running CPU-only. If the Nvidia card is applied, the calculated speed for WSI data analysis may increase 2-10 times.
2.1.1 Function a: Image patch nuclei segmentation
- Command:
run_patch_inference.py - Each input file size: <= 10MB
The computer/server hardware requirements - CPU: intel i5 or up, Mac M1/M2
- Memory: >=8GB
- Average execution time for each file is 2 - 10 seconds
2.1.2 Nuclei and TME feature extraction
- Command:
run_wsi_inference.py - Each input file size: 50MB - 600MB
The server hardware requirements - CPU: >16 CPU Cores
- Memory: >=128GB (>=128GB if the input file size is 50MB - 200MB; >256GB if the input size is 200MB - 600MB; Larger Memory such as 512GB if the input size is >600MB)
- Average execution time is 10 - 60 minutes (due to memory/input size ratio)
2.1.3 Function c: Image patch nuclei segmentation
- Command:
summarize_tme_features.py - Each input file size: 50MB - 600MB
The server hardware requirements - The same as 2.1.2
2.2 Install with docker
2.2.1. Install Docker
Check docker version
docker version
It is better to upgrade your version >= 23.*.*
2.2.2 Download the docker image
docker pull utsw1qbrc/hd_wsi
docker tag utsw1qbrc/hd_wsi:latest hd_wsi:latest
2.2.3 Initiate data analysis container
Linux / Mac Os
# create the folder for the files to analyze
cd ~
mkdir hd_wsi_slides

# initiate the container
docker run --ipc=host -dit -v ~/hd_wsi_slides:/usr/src/hd_wsi/slides_folder --name hd_wsi hd_wsi:latest
docker exec -it hd_wsi /bin/bash; conda activate hd_env
Windows (Use Windows PowerShell to run the commands
# create the folder for the files to analyze
# Go to C disk
# Create a folder 'hd_wsi_slides'

# initiate the container
docker run --ipc=host -dit -v c:\hd_wsi_slides:/usr/src/hd_wsi/slides_folder --name hd_wsi hd_wsi:latest
docker exec -it hd_wsi /bin/bash
conda activate hd_env
3. User Guideline of data analysis container
3.1 Function a: Image patch nuclei segmentation
The script run_patch_inference.py analyzes a single image patch or a folder of image patches with given model and outputs nuclei detection and segmentation results. Image patches are analyzed one-by-one without parallel, so image patches with different sizes are allowed. By default, model uses breast cancer HD-Yolo model to segment the following nuclei: tumor, stromal, immune, blood, macrophage, necrosis and others.
Input files: small image patch files; each path file size is <= 10MB
3.1.1 Example: run a single image patch using the test data (./test_data/patch_example.png
python run_patch_inference.py --data_path test_data/patch_example.png --output_dir /usr/src/hd_wsi/slides_folder/patch_result
- --data_path: the input patch file path
- --output_dir: the output result path
3.1.2 Example: run a single image patch using your data
# on your computer / server
# put one of your image patch file (such as patch1.png) under ~/hd_wsi_slides

python run_patch_inference.py --data_path /usr/src/hd_wsi/slides_folder/patch1.png --output_dir /usr/src/hd_wsi/slides_folder/patch_result
- --data_path: the input patch file path
- --output_dir: the output result path
3.1.3 Example: run all the image patches using your data under a folder
# on your computer / server
# put all your image patch files under ~/hd_wsi_slides

python run_patch_inference.py --data_path /usr/src/hd_wsi/slides_folder --output_dir /usr/src/hd_wsi/slides_folder/patch_result
- --data_path: the input patch files folder path
- --output_dir: the output result path
You can read all the results under ~/hd_wsi_slides/patch_result
### 3.2 Function b: Whole slide nuclei detection and segmentation The script `run_wsi_inference.py` accepts a single slide or a folder of slides as inputs and outputs nuclei detection and segmentation results from given model. By default, model uses breast cancer `HD-Yolo` model to detect the following nuclei: tumor, stromal, immune, blood, macrophage, necrosis and others.
[Hardware Requirement]
-
Whole slide image (WSI) data processing requires the necessary CPU and memory size, please refer to 2.1.2
-
The default options of our pipeline is CPU-only. However, the pipeline supports NVidia GPU card. By adding GPU options, the calculate speed will increase 2-10 times due to GPU performance.
3.2.1 Example: run a single example WSI image with pretrained breast cancer model on the sample BRCA slide with default options (CPU-only)
python -u run_wsi_inference.py --data_path test_data/wsi_sample.svs --output_dir /usr/src/hd_wsi/slides_folder/wsi_result_default
You can read all the results under ~/hd_wsi_slides/wsi_result_default
3.2.2 Example 2: run a single example WSI image by detecting only box on cpu with the default lung cancer model and export result to csv
python -u run_wsi_inference.py --data_path sample.svs --model_path lung --output_dir /usr/src/hd_wsi/slides_folder/wsi_result_box_only --box_only --save_csv
You can read all the results under ~/hd_wsi_slides/wsi_result_box_only
3.2.3 Example 3: run a customized model on a folder of slides with annotations. Export results to image, and save mask and text information into csv file.
# clean the folder ./slides on your computer/server
# put multiple WSI files under ./slides
# data process one wsi by one

python -u run_wsi_inference.py \
--data_path /usr/src/hd_wsi/slides_folder \
--meta_info text_color_info.yaml \
--model_path /path/to/model/ \
--output_dir /path/to/output_wsi \
--batch_size 4 --roi tissue
--save_img --save_csv \
--export_mask --export_text
c) Nuclei and TME feature extraction
The script summarize_tme_features.py takes the outputs from a) to extract a variety of nuclei and TME features. Currently, the following nuclei features and TME features are calculated:
Nuclei morphological features
- i.radius: average radius for nuclei type_i base on bounding bx size.
- i.total: total amount of nuclei type_i detected in results file.
- i.box_area.*: statistics of bounding box area of type_i.
- i.area.*: statistics of mask area of type_i.
- i.convex_area.*: statistics of mask convex_area of type_i.
- i.eccentricity.*: statistics of mask eccentricity of type_i.
- i.extent.*: statistics of mask extent of type_i.
- i.filled_area.*: statistics of mask filled_area of type_i.
- i.major_axis_length.*: statistics of mask major_axis_length of type_i.
- i.minor_axis_length.*: statistics of mask minor_axis_length of type_i.
- i.orientation.*: statistics of mask orientation of type_i.
- i.perimeter.*: statistics of mask perimeter of type_i.
- i.solidity.*: statistics of mask solidity of type_i.
- i.pa_ratio.*: statistics of mask pa_ratio (perimeter ** 2 / filled_area) of type_i.
Delaunay graph based features
- i_j.edges.mean: average nuclei distance of type_i <-> type_j interactions.
- i_j.edges.std: nuclei distances std of type_i <-> type_j interactions.
- i_j.edges.count: total No. of type_i <-> type_j interactions in all patches.
- i_j.edges.marginal.prob: i_j.edges.count/sum(x_y.edges.count), percentage of type_i <-> type_j interaction.
- i_j.edges.conditional.prob: i_j.edges.count/sum(x_j.edges.count), edge probability condition to type_j interaction.
- i_j.edges.dice: dice coefficient of i_x.edges and y_j.edges, overlap over union of type_i interaction and type_j interaction.
Density based features
- roi_area: overall tumor/tissue region.
- i_j.dot: dot product between type_i and type_j.
- i.norm: norm2(type_i), type_i density.
- i_j.proj: i_j.dot / j.norm, influence of type_i on type_j.
- i_j.proj.prob: use sigmoid activation to normalize i_j.proj into 0~1.
- i_j.cos: i_j.dot/i.norm/j.norm, similarity of type_i and type_j.
By default, Delaunay graph based features are summarized from a maximum of 10 random selected patches (2048*2048) in tumor region. Density based features are calculated with kernel smoothed density map that is 1/32 of the original image scale. Parameters can be changed based on needs, run python summarize_tme_features.py -h for detailed information about all options.
Example 1. Analyze results from sample.svs and save plots with default settings.
python -u summarize_tme_features.py --model_res_path test_wsi --output_dir ./test_features --n_classes 3 --save_images
Example 2. Customize Delaunay graph based and density based features: randomly select 100 512x512 patches with more than 10 tumor and calculate density under 1/16
python -u summarize_tme_features.py \
--model_res_path /path/to/output_wsi \
--output_dir /path/to/output_tme \
--n_patches 100 --patch_size 512 \
--score_thresh 10 --scale_factor 16 \
--save_images \
Result files
a) Image patch nuclei segmentation
slide_id_pred.pt: The torch file stores the outputs and inference time.slide_id_pred.png: The image file displays the segmentation/detection results.slide_id_pred.csv: The csv file containsboxes,scores,labelsandmasksinfo if--box_onlyis not triggered.
b) Whole slide nuclei detection and segmentation
slide_id.pt: The compressed object contains slide information, nuclei locations, scores and types, as well as inference time.slide_id.masks.pt: If model outputs masks and--box_onlyis not enabled, all nuclei masks shrinked into 28x28 pixel are stored in this file.slide_id.tiff: If--save_imgis enabled, script will plot a large pyramid tiff image with the same size as input slide (nuclei color are provided through--meta_infowith default transparency = 0.3). This file can be viewed through openslide and other tiff viewers. Don't enable this option for large image as it will take extremely long time to plot and save.slide_id.csv: If--save_csvis enabled, script will exportboxes,scores,labelsinto this csv file. If--export_textis enabled, script will replace numeric labels with text labels defined in--meta_info. If--export_maskis enabled, an extra column contains masks in polygon format will be added to the csv file. Note that TME feature extraction pipeline takesslide_id.ptas input, the csv file is not necessary for downstream analysis. Export csv with text and masks will cost extra time and take more space.
c) TME feature extraction
slide_id/feature_summary.csv: The csv file of slide_id x tme_features. Currently the following TME features are calculated.slide_id/feature_summary.pkl: The pickle file contains all the raw features without normalization/standardization (count, norm, dotproduct, etc.). This is useful when merging multiple slides under same patient.slide_id.slide_img.png: If--save_imagesis enabled, script will generate this thumbnail image.slide_id.scatter_img.png: If--save_imagesis enabled, script will generate a scatter plot for detection result.slide_id.density_img.png: If--save_imagesis enabled, script will export density plot for core nuclei type (by default, green: tumor, red: stromal, blue: immune).slide_id.roi_mask.png: If--save_imagesis enabled, script will export the roi region for feature extraction. (default is tumor region)
Tag summary
Content type
Image
Digest
sha256:7f6a2bcf7…
Size
4.5 GB
Last updated
over 3 years ago
docker pull utsw1qbrc/hd_wsi